TDM 10200: Project 13 - Topics Review
Project Objectives
Motivation: If you have made it this far, you hopefully now have a good introduction to working in Python. This project mainly focuses on reviewing some of the many topics we have already covered throughout this semester.
Context: From reading in datasets to making interactive maps, we hope this project helps you realize just how much you have learned throughout this semester.
Scope: Python, subsets, data cleaning, merging, mapping
Make sure to read about, and use the template found on the template page, and the important information about project submissions on the submission page.
Dataset
-
/anvil/projects/tdm/data/olympics/athlete_events.csv
-
/anvil/projects/tdm/data/olympics/regions.csv
-
/anvil/projects/tdm/data/mapping/country-coord.csv (used to get global country coordinates)
|
If AI is used in any cases, such as for debugging, research, etc., we now require that you submit a link to the entire chat history. For example, if you used ChatGPT, there is an “Share” option in the conversation sidebar. Click on “Create Link” and please add the shareable link as a part of your citation. The project template in the Examples Book now has a “Link to AI Chat History” section; please have this included in all your projects. If you did not use any AI tools, you may write “None”. We allow using AI for learning purposes; however, all submitted materials (code, comments, and explanations) must all be your own work and in your own words. No content or ideas should be directly applied or copy pasted to your projects. Please refer to GenAI page in the example book. Failing to follow these guidelines is considered as academic dishonesty. |
Olympics
The Olympic Games are a series of sporting events held around the world. They include Summer and Winter Games, which each occur every four years, staggered so an Olympic event takes places every two years. Olympics data is broken up into two datasets: Athlete Events, and Regions.
Athlete Events tracks the athletes competing in the events (from 1896 to 2016). There is information about the person - their name, sex, age, etc. as well as the competition - the season, city, sport, etc. The Athlete Events dataset contains 15 columns and 271,116 rows of data. Some of these columns include:
-
Height: athlete’s height in centimeters -
Team: team name / representing country -
Sport: sport played by each athlete
Regions tracks the teams that bring athletes to be in the Olympics. This dataset is on the smaller side. The focus being that it exists as a decoder for the National Olympic Committee 3-letter code (NOC) values, one given to each country/region.
Both the NOC and region values can be found in the Athlete Events dataset as well, but this specific Regions dataset will allow us to start with these columns already isolated.
This dataset does just contain 3 columns and 230 rows. These columns are:
-
NOC: National Olympic Committee 3-letter code -
region: country name -
notes: any notes about the listed country
Country Coordinates
This dataset acts as an additional resource to find the latitude and longitude values of the countries across the globe. It takes each country, and can provide information about it, such as the 2-letter or 3-letter abbreviation for the name. There are numeric codes as well. We will primarily be looking at three columns:
-
Country: official name of the country -
Latitude (average): average latitude value per country -
Longitude (average): average longitude value per country
Questions

Question 1 (2 points)
Read in the Athlete Events dataset:
import pandas as pd

myDF = pd.read_csv('/anvil/projects/tdm/data/olympics/athlete_events.csv')
There are a lot of different sporting events that take place at the Olympics. Look at the .value_counts() of the Sport column to view how commonly competed in some of these events are.
Gymnastics is one of the events with the most competing athletes. This, similar to the "Athletics" category, is an umbrella term, containing multiple different events while still being listed under the same sport.
Make a subset of myDF containing just the rows where the sport was listed as "Gymnastics". Within this subset, show how the number of people sent by the different countries (the "Team"s) are distributed.
1.1 What are some of the top sports based on player count?
1.2 Subset myDF to find only those who went to the Olympics for gymnastics.
1.3 How many gymnasts did France send to the Olympics (Team column can be used)?
Question 2 (2 points)
The 'Height' column of myDF has a lot of NA values. This is natural, as this historic dataset has been being recorded for many years, and records are imperfect. However, we will need to remove all of the missing values from Height.
Create a subset of myDF by "dropping" the NA`s! This is typically saved as `myDF_cleaned, or some similar name to indicate the change.
With the cleaned data, we can make groups to make everything easier to sort through. Group myDF_cleaned to find the average height per country. Save this as my_avg_heights, and sort the values.
|
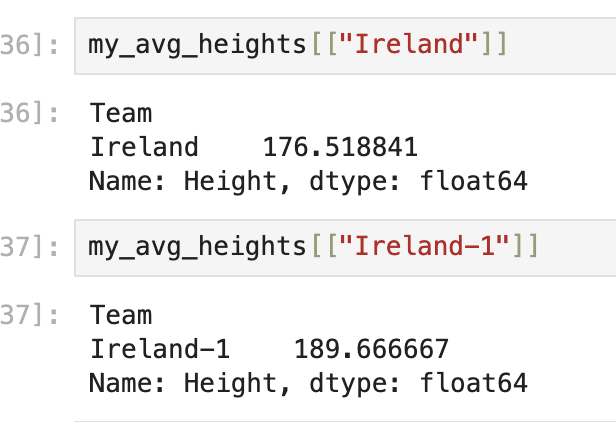
Some of the team names look to be entered incorrectly / problematically. The country listed as having the tallest athletes on average is "Puerto Rico-1". This should bring questions about how much we should trust these averages, and what other cleaning we could/should do before going deeper into this dataset. |
For an example, compare the actual "Ireland" vs the "Ireland-1" entries and their average heights:
2.1 Show the first five Olympians who actually have entered heights in the dataset.
2.2 What country, on average, had the tallest athletes? Do you think this is correct?
Question 3 (2 points)
Make a list of five countries (your choice). For example:
my_list = ["China", "India", "Poland", "Nigeria", "United States"]Within myDF_cleaned, you will have to go through the Team column to find the actual entries from the dataset that match the strings in your list. Save this as my_countries, and show the value counts.
There are many different ways you could plot any results you get from working with your my_countries. In this case, take my_countries, and create a plot (boxplot, barplot, other plotting methods) to compare some attribute across your chosen countries.
One way you could do this is to make a boxplot that compares the teams (chosen countries) against the heights. This would allow you to get a good look at not only the averages, but also the max, min, etc. of the heights of the athletes from the countries you have chosen to look at.
import seaborn as sns
import matplotlib.pyplot as plt
# seaborn boxplot template (to get you started)
sns.boxplot(data=, x='', y='')
plt.title("")
plt.show()3.1 Select some countries to subset from myDF_cleaned.
3.2 How many competing athletes came from each of your chosen countries?
3.3 Display your plot and briefly explain.
Question 4 (2 points)
Read in the Olympics Regions, and Country Coordinates datasets:
regions = pd.read_csv('/anvil/projects/tdm/data/olympics/regions.csv')

country_coords = pd.read_csv('/anvil/projects/tdm/data/mapping/country-coord.csv')
Look at the first few rows of each of these datasets. There seems to be some opportunity to perform a merge, as the 'region' and the 'Country' columns of regions and country_coords, respectively, contain the names of the countries across the world.
regions contains a list of all of the countries that competed in the Olympics. It would be great to get the (average) latitude and longitude locations of each country so these locations can be put onto a map.
Use .merge() to combine the two datasets.
|
We want to keep the 'region' column, and only take the values of 'Country' that match. You will assign a |
Finally, in my_merged, be sure to clean 'Latitude (average)' and 'Longitude (average)' of any NA values.
4.1 Read in the datasets.
4.2 Merge the datasets on the country names columns.
4.3 Drop any NA values from both the lat and the lng columns of my_merged.
Question 5 (2 points)
Import folium. We have worked just a little bit with this library from Project 12!
Initialize your mapping space:
import folium

my_map = folium.Map()
my_map
Iterate through my_merged, and assign there to be a marker displayed at each average latitude and average longitude pair. You may recall that this is how we were adding markers to the map:
for index, row in df.iterrows():
    folium.CircleMarker(
        location=[row['col_1'], row['col_2']],
        radius=5
    ).add_to(my_map)
When mapping these markers (circle or otherwise), add popups to tell the name of the respective country of each. This would be using that 'region' column from before.
5.1 Make a map in folium.
5.2 Add markers to your map at each home location of at least one Olympian.
5.3 Add popups to said markers to display the names of the countries.
Submitting your Work
Once you have completed the questions, save your Jupyter notebook. You can then download the notebook and submit it to Gradescope.
-
firstname_lastname_project13.ipynb
|
It is necessary to document your work, with comments about each solution. All of your work needs to be your own work, with citations to any source that you used. Please make sure that your work is your own work, and that any outside sources (people, internet pages, generative AI, etc.) are cited properly in the project template. You must double check your Please take the time to double check your work. See submission page for instructions on how to double check this. You will not receive full credit if your |