TDM 40100: Project 2 - Basic Python, Environment & Dependency Management, Documentation
Project Objectives
This project is an introduction to Python dependency management and environments. We will explore how to create and use different environments, and how to manage them afterwards. This is very closely related with dependency management and making sure we can make it easy for others to take on the project, while solving problems when they arise; thus, we will take a look at some common tools and conflict resolution techniques. We integrate this learning with analyzing data driven problems. The dataset deals with global C02 and greenhouse gas emission. Since this is one of the introduction projects, this part will also serve as a refresher on basic Python implementation, and relevant documentation methods.
Dataset
/anvil/projects/tdm/data/co2/owid-co2-data.csv github.com/owid/co2-data
Useful Things
You can safely ignore this if you are not running into any issues with trying to run pipreqs as described in the project.
If you are running into issues some of these may help fix your situation but if they don’t feel free to reach out to us on Piazza/Office Hours.
If you installed pipreqs into your environment, using the absolute path will always work:
~/.conda/envs/{myenv}/bin/pipreqs .If you want to not have to use the absolute path and are running into an issue saying its not found in the local bin, then you can remove it:
rm ~/.local/bin/pipreqsThen run hash -r which clears shell location history so it will resolve the locations again according to path:
hash -rNow pipreqs should work like normal:
pipreqs .Questions
Question 1 (2 points)
In programming, dependency means there are external libraries and packages that are used for project features to work. There are several reasons why we need to manage dependencies. First is reproducibility. This means regardless of the way the code is ran, we obtain the same results every time. This also means if there is a problem and multiple people are looking at the project, the same issue will occur. The importance of reproducibility shows in all stages of development: you will make it easier for yourself if you can recreate the setting for all code to work, and for others if there are multiple people working on it.
The common issue that arises from no dependency management is version conflicts: two or more libraries used requires different versions than the one you installed because all of them are globally installed locally.
Thus, we can use virtual environments, to create a separate space for all of one project’s dependencies so that regardless of what we have in our system’s global installation or what other projects use, the one we are working on runs smoothly.
|
Since we are working on a cluster that has some sort of central python module management, we need to do a couple extra things to make sure our environment is set up correctly. |
We will try creating a virtual environment using Conda. Open your terminal or command prompt and navigate to the directory where you want to set up your project. Then run the following command (replace env_proj with your preferred environment name if desired):
conda create -n env_proj python=3.11 -y|
You may need to run |
This will create a new conda environment called env_proj that explicitly installs the specified version of python into the environment. You can name it anything, but it should be easily recognizable and relevant.
Use below code to activate the environment.
conda activate env_projYour conda environments are located in the directory ~/.conda/envs/ which we can check out by doing either of these below:
ls ~/.conda/envs/

conda env list
However, if we run (which you should always do if you are running into python environment issues):
which pythonWe will still see this as our current python:
/anvil/projects/tdm/apps/lmodbin/python-seminar/python
Our shell is still defaulting to run from the seminar python environment, which in most cases is likely what we want when working on Anvil. However, for this project we want to practice creating a new environment from scratch.
The reason it still defaults to run from the seminar environment is due to our shell’s PATH environment variable which you can see by running:
echo $PATHIt is helpful to do some more research on how PATH works in your shell but for this project we can fix the issue by simply prepending our PATH with our new conda environment like so (change the name of the environment as necessary):
export PATH=~/.conda/envs/env_proj/bin:$PATH|
If you restart your shell you will need to rerun the export line unless you actually add it to the end of your |
|
This is slightly nonstandard and is a workaround for this project but it may be useful for other scenarios you may run into involving the PATH env variable. |
If you rerun the echo $PATH you should see that the path to your conda environment is at the front which means your shell will default to that python first.
Now when we run which python we should see:
/home/{x-username}/.conda/envs/{yourenvname}/bin/python
Now we should be able to use the environment like normal on Anvil!
You may also know about pip which is another python package management tool in Python for libraries or modules that are not in the Python standard library; it searches through Python Package Index (PyPI), which is a public repository of open source packages that can be installed. Developers create setup containing metadata of the package and build distribution files, then upload to PyPI. When install command is ran by the user, pip locates the package in PyPI, resolve dependencies, and download wheels.
There is an analogous version of PyPI and set of commands for Conda which function about the same. Note that some packages or versions of packages may only be on one or the other, however all pip commands will work in a conda so you can install packages from PyPI into your conda environment. We will touch more on Conda later but for now we will go over the various pip commands:
-
Install (with version specification if needed)
pip install {name}
pip install {name}=={version}
-
Uninstall
pip uninstall {name}
-
Show information about installed package
pip show {name}
-
List installed packages
pip list [options]
There are multiple options available for most pip commands. We recommend you to check the documentation for full listings. (for example: pip.pypa.io/en/stable/cli/pip_install/ for pip install)
Don’t do it yet, but deactivating the conda virtual environment is very simple with:
conda deactivateWe have one last step before being able to use this environment in our Jupyter Notebook - we need to make it a kernel!
For every other project we have been using the seminar kernel, which is a special form of a python environment that allows it run in a Jupyter Notebook.
Creating a kernel is actually very simple. Make sure you have your desired environment activated, then we can first install the ipykernel package and then install our environment as a kernel like so:
pip install ipykernel

python -m ipykernel install --user --name={yourenvname} --display-name "YourEnvName"
If you wait a minute or so, your brand new kernel should appear as an option in the menu in the top right where it normally says seminar!
Now, let’s open a Jupyter notebook using our brand new kernel and load the dataset in the environment we created.
import pandas as pd

url = "https://raw.githubusercontent.com/owid/co2-data/master/owid-co2-data.csv"
df = pd.read_csv(url)

print("df shape:", df.shape)
df.head()|
Example of ModuleNotFoundError This would have occurred if for example, the pandas library could not be found in the current environment - Python cannot import what doesn’t exist. |
If you try to import a library you did not install into your environment, we can see a similar error as above when trying to load up the dataset.
To fix this, head back into your command line and install pandas into your environment:
pip install pandasNow we should have pandas installed and you can import the dataset.
|
If you need to install a new package, you will need to go back to the command line, activate your environment, and install it like described here. You may or may not need to restart your kernel so it can use the newly downloaded packages. |
Refer to the deliverables below for what to do with the dataset.
-
1a. In your own words, write a few sentences explaining when and why virtual environments are used. Do the same for dependency management.
-
1b. Create an environment for this project and install everything shown above. (Use run this command in your notebook to show your new environment listed:
!ls /home/{x-username}/.conda/envs/) -
1c. Load the dataset into a pandas data frame and print the shape and head of the dataset. Write a few sentences on your observation and initial thoughts about the dataset.
-
1d. Print the number of unique countries and their names.
-
1e. Find and show the number of missing values and duplicates, and where we have them. Drop the missing values and remove duplicate rows if exists. Show the output.
-
1f. Filter the dataframe to get only the rows with "United States" as their 'country' column value, and assign into a new dataframe.
Question 2 (2 points)
pip list and pip freeze both output the installed Python packages. Try running both:
-
pip list
Package                 Version
----------------------- -----------
matplotlib              3.10.3
-
pip freeze
matplotlib==3.10.3You’ll notice that the formatting are different. pip list will return a table format with separate columns for packages and current version. pip freeze returns a list in a requirement format (package-name==version), compatible with:
pip install -r requirements.txtOne can install all dependencies needed for a project using requirements.txt. On our end, we can create the file with:
pip freeze > requirements.txtAnother way we can create a requirements file is through pipreqs.
pip install pipreqsAnd we can confirm it with:
pip show pipreqsWhich should show something like:
Name: pipreqs
Version: 0.5.0
Summary: Pip requirements.txt generator based on imports in project
Home-page: https://github.com/bndr/pipreqs
Author: Vadim Kravcenko
Author-email: [email protected]
License: Apache-2.0
Location: /home/{x-username}/.conda/envs/{envname}/lib/python3.11/site-packages
Requires: docopt, ipython, nbconvert, yarg
Required-by:
Or this if it was not installed correctly:
WARNING: Package(s) not found: pipreqs
Note: you may need to restart the kernel to use updated packages.
If it all worked then we can run:
pipreqs .|
If you are running into issues with |
. is to indicate current directory. pipreqs will scan all .py files and get all import x and from x import y statements, find PyPI package name, and your installed version. Alphabetical ordering is used to write package==version into requirements.txt.
Depending on the situation, there are flags we can use with pipreqs, including
-
--force (overwrite existing requirements.txt)
-
--print (outputs detected dependencies instead of writing to file)
-
--ignore <dir> (specific directory not taken into considering when scanning)
-
--clean <file> (remove modules that are not imported anymore), etc.
Again, we recommend you to check documentations to see all available options.
-
2a. What is a requirement file and what is it used for? Also, explain in your own words two methods of creating requirements.txt mentioned above, and the difference between them.
-
2b. Try creating requirements.txt using
pip freezeandpipreqs. Show results for both.
Question 3 (2 points)
We created a conda environment in Question 1, but we have only covered pip so far.
Conda is another widely used environment management system, with the main difference from a pip virtual environment being that it works across multiple languages and is not limited to Python packages. It is also fast since we are installing precompiled binary packages on Conda; users have less worries when it comes to compiling extension modules of libraries written in different languages. Another difference is that while most environments are created and used at the scope of the project, Conda environments can be used across various projects and be activated from any location.
We already went over some of these in the first problem but we will do it again here:
conda create --name <env>Replace <env> with your environment name. You can also specify Python version by adding 'python=version' at the end.
Activate with:
conda activate <env>Deactivate with:
conda deactivateTo check what is installed in the conda environment, use the conda list command.
conda listNote that you can check package list in a different Conda environment with
conda list -n <other environment name>Remove existing environment with:
conda remove --name <env> --allIt will remove the environment, dependencies, and packages.
You can check list of other commands at: docs.conda.io/projects/conda/en/stable/commands/index.html
We can install with:
conda install pandas matplotlib numpy seabornAgain, we want our environments to be reproducible. Conda uses .yml file to do so, which is a text file using YAML formatting (very widely used for creating software project configuration files).
Below command that outputs a file called environment.yml containing environment information regarding name, installed packages, versions, and other configuration details.
conda env export > environment.ymlThe file structure will look something like:
name: env_proj
channels:
  - defaults
dependencies:
 - pandas=2.3.1
- and other dependencies you have installed-
name: The name of your conda environment
-
channels: Section listing which conda channels the packages should be obtained from. Default (default by Anaconda) and conda-forge (open source contributors - we can get packages from here) are two very common channels.
-
dependencies: Section listing all packages that should be installed in the environment. Packages are named following "-" and the version number can be specified with "=" after the name. If there are any pip installed packages, it will be listed under a subsection "pip:"
In the environment we created, let’s create some visualizations from our dataset (this should also be a refresher on basic python visualization and methods). Here is an example:
import matplotlib.pyplot as plt
import seaborn as sns

plt.figure(figsize=(10,4))
sns.lineplot(data=usa_data, x='year', y='co2')
plt.title("USA Annual co2 Emissions (million tonnes)")
Above is a graphical representation of the annual USA carbon dioxide emission.
Read and understand what each columns represent here: github.com/owid/co2-data/blob/master/owid-co2-codebook.csv
-
3a. Try creating, activating, and installing packages using Conda.
-
3b. Create an environment.yml file. Explain what this file contains and what it is used for.
-
3c. What are some advantages of using conda environment? Do you think there are any disadvantages? How does conda differ from some other environment management systems?
-
3d. Graph the annual USA carbon dioxide emission
-
3e. Create two more graphs representing relationships of your choice. Explain what we can infer from those graphs.
Question 4 (2 points)
We will be writing a function that outputs a graphical representation of CO2 emission by sector for a given year. If you look at the columns of the dataset, it provides information on the annual CO2 emission for each sources (coal, cement, gas, oil, and other industry causes).
def plot_emission(df, year):
    sources = {'coal_co2': 'Coal', 'cement_co2': 'Cement', 'gas_co2': 'Gas',
               'oil_co2': 'Oil', 'other_industry_co2': 'Other Industry'}
Additionally, once you have your code written, you will write a docstring for this. Docstring is a way to document your code by describing usage and functionality using string literal. They appear first in a module or a function, and we declare them with three single or double quotes.
Documentation is important for several reasons. - Documentation explains not only about the code, but also gives insight into why we have it, functionality, and various specifics of the function or a class. This is helpful to both yourself as you code, and to others who might see your code, or work on a project with you to understand implementation details well. Efficient collaboration is one of the big part. - It supports debugging or problem solving by providing references and information about the program. It will help reduce time or minimize certain errors.
We will document using Google Style Docstrings. This formatting includes description, function arguments, returns, and raises. Read section 3.8 of in google.github.io/styleguide/pyguide.html.
Here is an example:
def plot_emission(df, year):
    """
    For a specific year, creates a bar plot of CO2 emission by sector.
    Sector includes Coal, Cement, Gas, Oil, and Other Industry.
    The plot displays emission values and
    how much each source contributes to total emissions by percentage.

    Args:
        df (pandas.dataframe): owid dataset containing global CO2 and Greenhouse gas emission information.
        year (int): The year for which emission information will be taken and plotted.

    Returns:
        tuple
        A tuple containing Matplotlib figure and axes object
    """

    sources = {'coal_co2': 'Coal', 'cement_co2': 'Cement', 'gas_co2': 'Gas',
               'oil_co2': 'Oil', 'other_industry_co2': 'Other Industry'}

... and rest of the function|
When we write string literal for docstrings, there is a doc attribute holding docstring of the object. So, we can access docstring with ".doc" (ex. print(function_name.doc)) |
-
4a. Write a function take takes in a dataframe and a year and outputs a bar plot of emission of each sources for that given year. Calculate the percentage for each sources and show that as well.
-
4b. Include Google style docstring for the function.
-
4c. There are multiple docstring formatting that can be used. Research another one of your choice and write one.
Question 5 (2 points)
In this question, we are going to try out pdoc, a tool for automatically generating API documentation.
First, we’ll briefly take a look at python scripts since we will be using that for pdoc. Python script is a file with .py extension and it can be run in any way as long as Python is installed. Some ways they are ran include integrated development environment (IDE), text editors, command lines and terminal, interactive mode, or even from another script or web browsers. The given script is read by Python line by line.
We can run scripts in terminal by:
python filename.pyIf using a text editor or an IDE, Python should be available (otherwise you can get an extension if text editor) and then can be ran.
Notebook content can be exported as a .py module with below command (nbconvert can convert notebook documents to other formats too):
jupyter nbconvert --to script 'project.ipynb'From the py module, pdoc scans our python functions and classes and extract the docstring documentation. HTML page is created from that.
To use pdoc, run:
pdoc ./file_nameCreating an HTML file, we can run:
pdoc ./file_name.py -o ./docsYou should see a .html file created in under docs directory.
Here is a basic example. pdoc should output something like below for you:
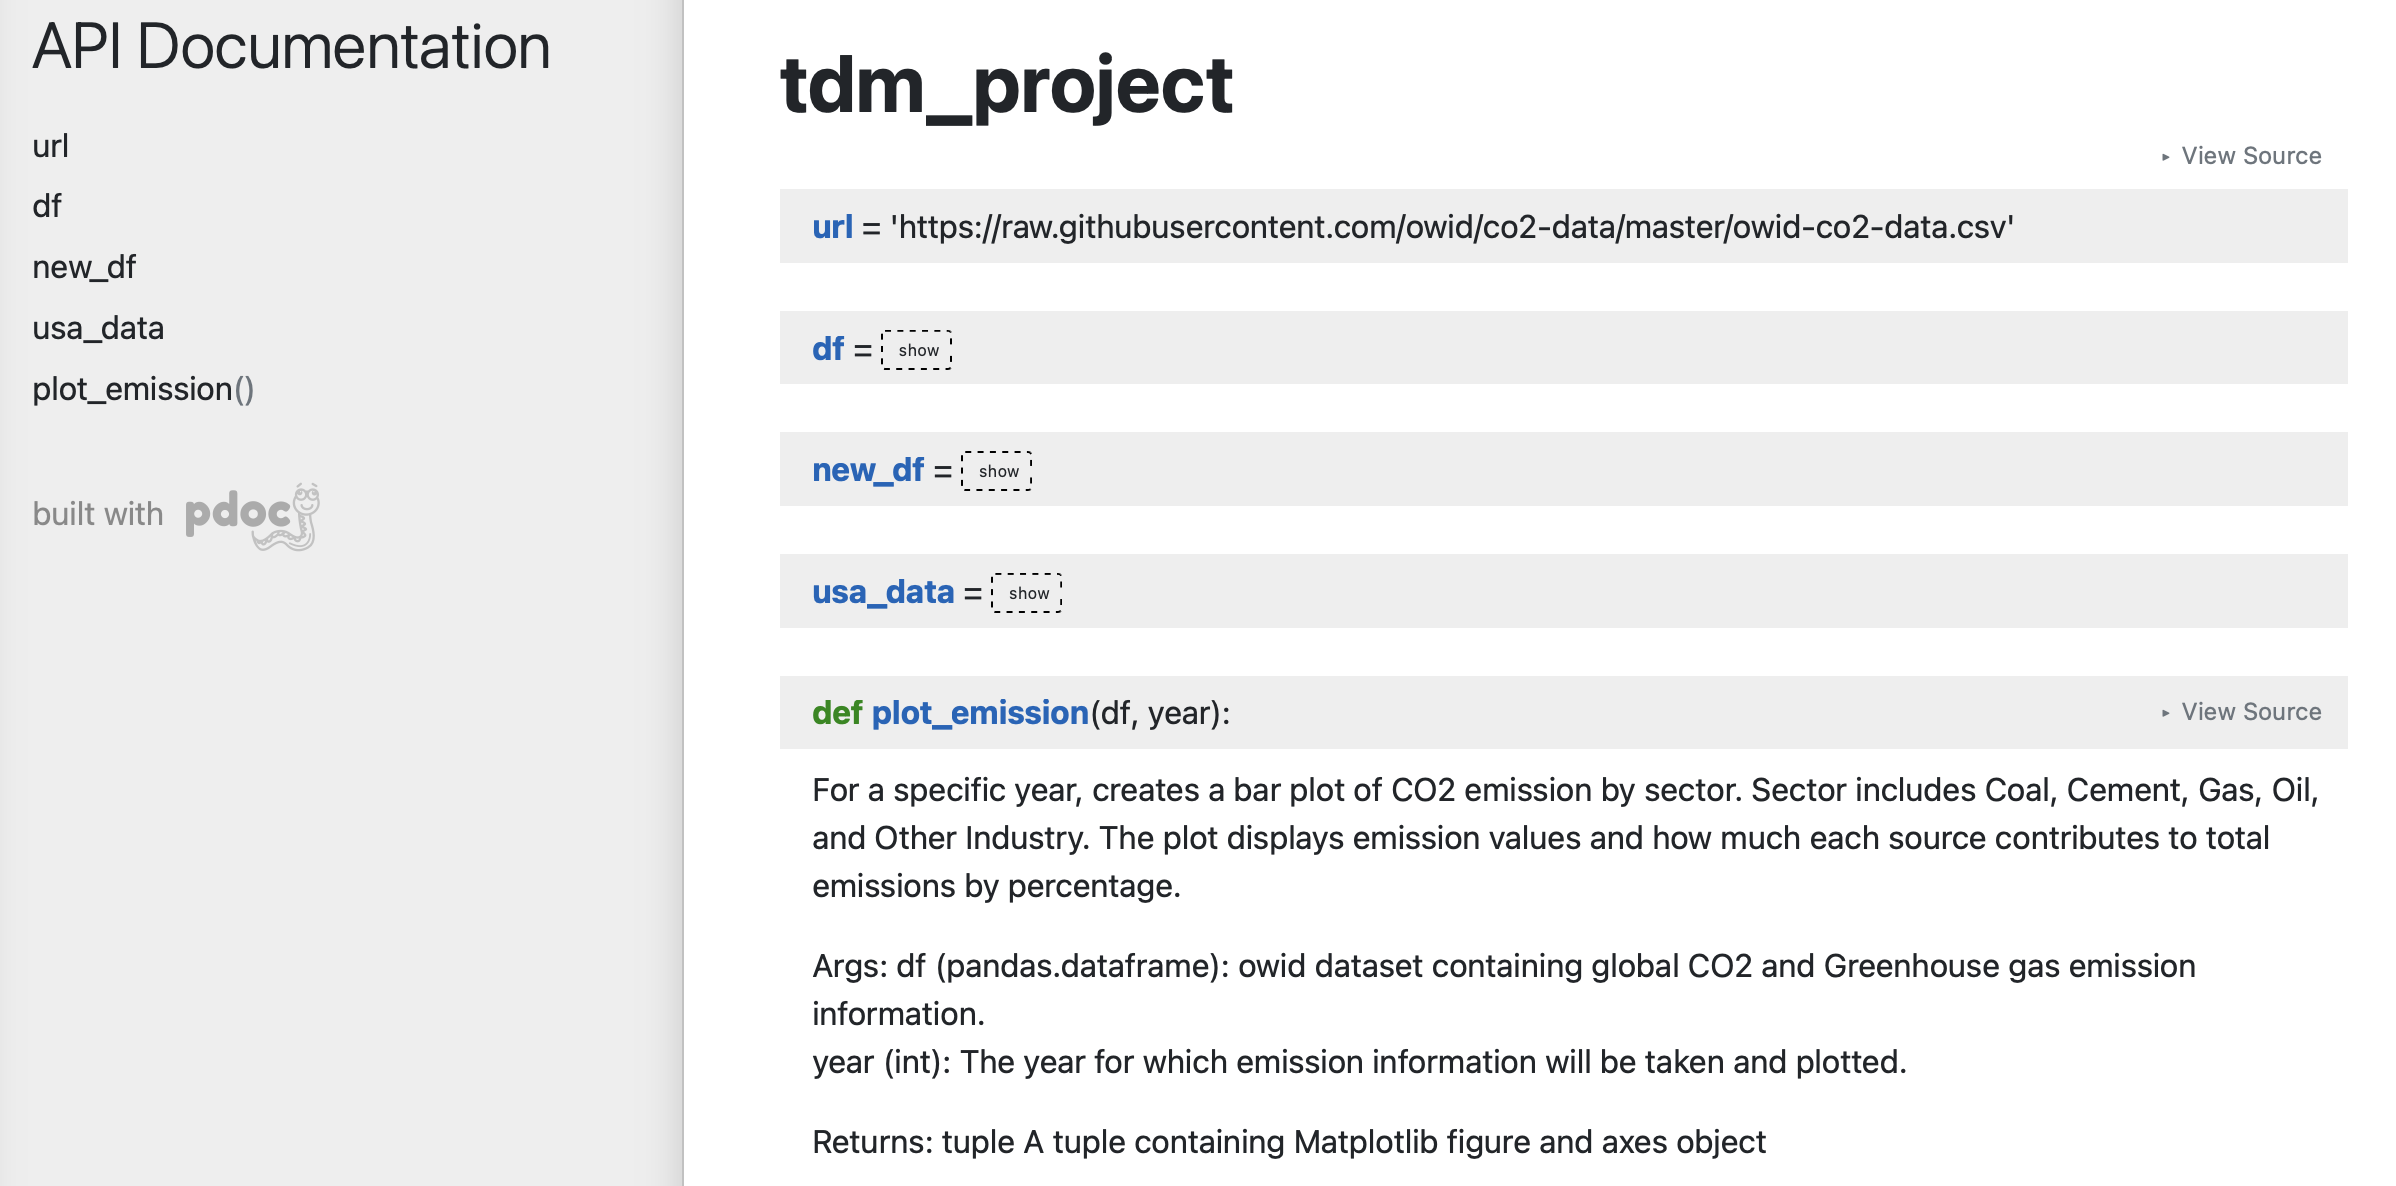
There are customizations we can add to pdoc. For example, adding logo like below:
pdoc ./demo.py --logo "link to logo"|
pdoc official documentation: pdoc.dev/docs/pdoc.html |
-
5a. Submit the .py file alongside your .ipynb
-
5b. Try using pdoc and submit a screenshot of pdoc result.
-
5c. Submit a screenshot of a pdoc version including a logo.
Question 6 (2 points)
Sometimes, we need to make changes to our environment, for example adding more packages or needing a newer version of an existing package. For us, we just added a new pdoc install.
Here is how to make changes in a conda environment. Run below command after editing environment.yml as needed. It will update the existing environment by comparing packages and version in the file with the installed ones; if there are any packages that do not exist in the environment but listed in environment.yml, it will install them, and likewise if there are packages not used anymore that are present, it will remove them (specified with --prune).
conda env update --file environment.yml --prune-
6a. Edit and update environment.yml. Write down what you added to the environment.yml
-
6b. Research another dependency management system/tool of your choice. How is it different from the ones we explored? Is there a specific case where we might want to consider a specific management tool?
Submitting your Work
Once you have completed the questions, save your Jupyter notebook. You can then download the notebook and submit it to Gradescope.
-
firstname_lastname_project2.ipynb
|
It is necessary to document your work, with comments about each solution. All of your work needs to be your own work, with citations to any source that you used. Please make sure that your work is your own work, and that any outside sources (people, internet pages, generative AI, etc.) are cited properly in the project template. You must double check your Please take the time to double check your work. See here for instructions on how to double check this. You will not receive full credit if your |