TDM 10200: Project 3 - Grouping in Python
Project Objectives
Motivation: Learning how to efficiently group and reshape data in Python is a valuable skill. These tools such as .value_counts(), .groupby(), and .sort_values() help us to simplify complex datasets so they can be used more easily.
Context: We will work with two separate dataframes in Python and compare them using different grouping approaches.
Scope: Python, grouping, value counts, sorting
Make sure to read about, and use the template found on the template page, and the important information about project submissions on the submission page.
Datasets
-
/anvil/projects/tdm/data/grouping/vgchartz-2024.csv
-
/anvil/projects/tdm/data/grouping/googleplaystore.csv
|
If AI is used in any cases, such as for debugging, research, etc., we now require that you submit a link to the entire chat history. For example, if you used ChatGPT, there is an “Share” option in the conversation sidebar. Click on “Create Link” and please add the shareable link as a part of your citation. The project template in the Examples Book now has a “Link to AI Chat History” section; please have this included in all your projects. If you did not use any AI tools, you may write “None”. We allow using AI for learning purposes; however, all submitted materials (code, comments, and explanations) must all be your own work and in your own words. No content or ideas should be directly applied or copy pasted to your projects. Please refer to GenAI page in the example book. Failing to follow these guidelines is considered as academic dishonesty. |
Video Game Sales
The video game industry has evolved into one of the world’s largest entertainment sectors, generating over $180 billion annually and surpassing both the movie and music industries combined. This market creates rich opportunities for data analysis, as gaming companies are constantly seeking to understand consumer preferences, market trends, and the factors that drive commercial success.
This dataset contains both numerical and categorical variables, making it ideal for developing data science skills by providing numerous cases for us to explore data grouping, analysis, and visualization.
There are 14 columns and 64016 rows of data for us to work with. These columns include:
-
title: official title of the video game -
console: video game console models by many different companies -
genre: category for video games based on the content’s theme -
critic_score: numerical rating assigned to each game on a scale of 1 to 10 reflecting the overall opinion of the game’s quality -
total_sales: approximate number of copies (millions) sold of each game across all locations
Google Play Store
The Google Play Store, released in 2008 as "Android Market", is the very popular marketplace for users of Android devices. It is used by over 2.5 billion users monthly to discover, download, and update a vast number of applications including games, movies, books, and more. There are millions of apps and games available. This store has over 150 billion items downloaded from it in the past year.
There are 13 columns and 10841 rows of data for us to work with. The main columns we will be working with are:
-
Rating: numerical decimal rating (1 - 5) showing average score of each app -
Reviews: count of reviews left per app, ranging from 0 to over 10 million -
Content Rating: suggested target audience based on app’s theme
Questions

Question 1 (2 points)
Load the Video Game Sales dataset from the file /anvil/projects/tdm/data/grouping/vgchartz-2024.csv into a dataframe called video_games.
# Group the data by genre
# Show the average critic score per genre
video_games.groupby("genre", as_index=False)["critic_score"].mean()
One thing we might choose to examine is the critic scores. These are important because they create a standardized way to gauge the quality of a game before buying it. We could look at the average critic scores by genre using the .groupby() function.
The .groupby() method is used to split a dataframe into groups, apply a function to each group, and combine the results. This is used in a similar fashion to the tapply() function in R’s dplyr library. The .groupby() function has format df.groupby(KEY)[COLUMN].FUNCTION(), where
-
KEYis the column(s) to group by -
COLUMNis the column whose values will be summarized -
FUNCTION()is the function to apply (.mean(),.sum(), …) -
… and any additional arguments that you will add to the function
So, we could do video_games.groupby("genre", as_index=False)["critic_score"].mean() to find the average critic score within each video game genre. It looks very simple. If we didn’t care about the results being in a dataframe format, it is fine to remove the additional argument - as_index=False, and have the output be a series. These groups and their values can be sorted, cleaned of NA values, and more.
|
There are |
Try sorting the genres by the critic score values. Which genre had the highest on average?
Let’s try something new. total_sales describes the number of copies of each video game and console pairing that has been sold worldwide. console shows the gaming system that each listed game is compatible with.
Group by the console type to find the total sales per gaming system. Which console has had the most sales?
1.1 Which video game genre has the highest average critic_score?
1.2 Which console has the highest number of total_sales?
1.3 In 3-5 sentences, explain in your own words how we can group data in python and why it is useful.
Question 2 (2 points)
Back in the original video_games dataframe, there is the critic_score column which has the ratings given to each game on a scale of 0 to 10. Create a new column high_rated that contains the values from the critic_score column that are a score of 7 or more. What does the result of this look like?
There are many False values shown in the value counts of high_rated. Make a column low_rated to show the values that are strictly less than 7.
The False values from the .value_counts() of high_rated and 1 should not look right. This is because there are actually 57338 NA values which have not been accounted for.
|
Use |
Take the high_rated column and create a new dataframe called sports_hits that includes all columns from video_games, but only for highly rated games in the Sports genre.
Find the games listed in sports_hits that have a critic_score of 9.5.
sports_hits[sports_hits['critic_score'] == 9.5]
Using the low_rated column, create a new dataframe called sports_fails that includes all columns from video_games, but only for Sports genre games that are listed as low_rated. In this dataframe, identify which games have a critic score of 2.8.
2.1 Show the counts of the True/False values of the high_score and low_score columns
2.2 What games in sports_hits had a critic_score of exactly 9.5?
2.3 What games in sports_fails had a critic_score of exactly 2.8?
Question 3 (2 points)
Look at the first five rows of video_games. Each row in video_games represents one game. There is no column specifically counting the number of games in the dataset - but we can do this ourselves.
Group the data by the genre column. This will allow us to see how the games are distributed throughout the different genres in the dataset.
Show how many games fall into each genre.
Use genre_counts = video_games.groupby("genre", as_index=False)["title"].count()
or
genre_counts = video_games.groupby("genre", as_index=False).size()
|
If you would like to change the names of the columns in |
The function .sort_values() is very handy for sorting dataframes. It lets you specify the column for which you would like to sort by.
Sort genre_counts in descending order so that the genre with the largest count of games appears first. Be sure to print the first 10 rows.
|
It is OK if you print the entire |
3.1 Which genre has the most games listed in the dataset?
3.2 Show the first 10 rows of the sorted genre_counts dataframe.
3.3 Create console_genre_counts, which is video_games grouped by console AND genre. Print the first 5 rows of console_genre_counts.
Question 4 (2 points)
Read in the Google Play Store dataset: /anvil/projects/tdm/data/grouping/googleplaystore.csv into a dataframe called app_store.
To start, checkout the Rating and Reviews columns of app_store. Each app in the Google Play Store has a rating (0-5). This is not the best way to judge an app’s quality, since:
-
Apps with high ratings but few reviews have a larger value,
-
Apps with many reviews and even the same rating will have a smaller value.
Finding the rating per review can help to find any under-reviewed apps that have high ratings but a lower vote count. The rating-per-review calculation is numerical, but currently the Reviews column is full of character data. This will not work.
Use app_store.dtypes to find the types of the data in the columns of app_store.
Typically, a column like Reviews would be numeric data rather than strings. We can’t go through every single entry in this column as there are hundreds of different Review score values.
|
It is extremely likely that this column contains values like "1,234", "Free", or NA values, with the "," and letter characters that cannot be easily converted to numeric. |
# Remove any commas that may exist
# Replace with "" (nothingness)
app_store["Clean_Reviews"] = app_store["Reviews"].str.replace(",", "", regex=False)
# Convert all values to type float (decimal numbers)
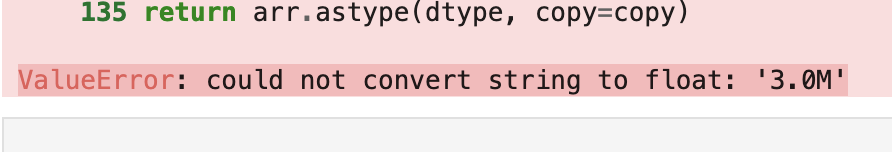
# ATTENTION: This line will cause an error message to appear
app_store["Numeric_Reviews"] = app_store["Clean_Reviews"].astype(float)At the very bottom of the error message, you should notice text alerting you of a specific value causing a problem.
 = app_store["Clean_Reviews"].astype(float)]
Remove the "3.0M" value from Clean_Reviews, and run the line with .astype(float) again.
|
The comparison operator "!=" is used to take values that are not equal to a specified value. |
Now we can calculate the ratings per review values with both the numeric columns Rating and Numeric_Reviews. Divide the Rating column by the Numeric_Reviews column to create the new column rating_per_review.
4.1 Which string value was causing an error when creating the numeric reviews column?
4.2 Create Numeric_Reviews from Clean_Reviews, removing the 3.0M value.
4.3 Display head of the rating_per_review column.
Question 5 (2 points)
In the Google Play Store dataset, there is a column called Content Rating. This column contains 6 types of rating based on the suggested target audience for each game. We can find this using .unique():
-
Everyone -
Teen -
Everyone 10+ -
Mature 17+ -
Adults only 18+ -
Unrated
|
It is good to check how many unique values there are before printing them all out. In this case, it was fine because there were 6, but in the future when looking for the unique values, it is useful to test using the form |
In cases where there are a lot of unique values, it can happen that there are two values that are actually the same but were entered differently in a case-specific environment (such as everyone vs Everyone vs EVERYONE). This common error can be fixed by setting all the text to capital letters. While it isn’t needed with this column, we can still apply this technique to these values as a learning case.
.str.upper() takes every value in a string column and converts them to uppercase letters. Use it here to convert the Content Rating column to all capital letters. Save this as a new column called New_Content_Ratings in the dataframe.
Use .unique() to find what entries there are in this New_Content_Ratings column.
Use .groupby() to group the dataframe by the New_Content_Ratings column, to get the count of how many apps there are per category.
The App column is useful here.
5.1 Show how many unique Content Rating values there are in the Google Play Store dataset.
5.2 Display the first 5 entries of the New_Content_Ratings column
5.3 Which content rating category has the most apps?
Submitting your Work
Once you have completed the questions, save your Jupyter notebook. You can then download the notebook and submit it to Gradescope.
-
firstname_lastname_project03.ipynb
|
It is necessary to document your work, with comments about each solution. All of your work needs to be your own work, with citations to any source that you used. Please make sure that your work is your own work, and that any outside sources (people, internet pages, generative AI, etc.) are cited properly in the project template. You must double check your Please take the time to double check your work. See submission page for instructions on how to double check this. You will not receive full credit if your |