TDM 20100: Project 1 — Welcome to bash!
Motivation: Using bash allows you to navigate through files, search for patterns, create, modify, and delete thousands of files with a single line of code, and more! In the next few projects we’ll be learning all about bash and what it is capable of. In just a few weeks, you’ll be well on your way to mastery of bash shell.
Context: Experience working in Anvil will make this project easier to start but is not a prerequisite.
Scope: Anvil, Jupyter Lab, bash, GNU, filesystem navigation
Dataset(s)
This project will use the following dataset(s):
-
/anvil/projects/tdm/data/bay_area_bike_share/kaggle/ -
/anvil/projects/tdm/data/bay_area_bike_share/baywheels -
/anvil/projects/tdm/data/election
It’s been a long summer, so let’s start our first project this semester off with a quick review of Anvil. In case you haven’t already, visit notebook.anvilcloud.rcac.purdue.edu and log in using your ACCESS account credentials. If you don’t already have an account, follow these instructions to set one up. If you’ve forgotten your account credentials or are having other issues related to Anvil, please reach out to [email protected] with as much information as possible about your issue.
|
Your ACCESS account credentials may not necessarily be the same as your Purdue Career account. |
Once logged in, start a new Anvil session with 2 Cores and 4GB RAM. In the new Anvil website, you do not have a pre-defined time limit for your session. Anvil will automatically log you out when you have not worked in the Jupyter Lab for a given period of time (something like 15 or 20 minutes).
|
To start a new session on Anvil, please note that we are using notebook.anvilcloud.rcac.purdue.edu this year, instead of last year’s URL ondemand.anvil.rcac.purdue.edu/ You should now be on a screen that looks like this: 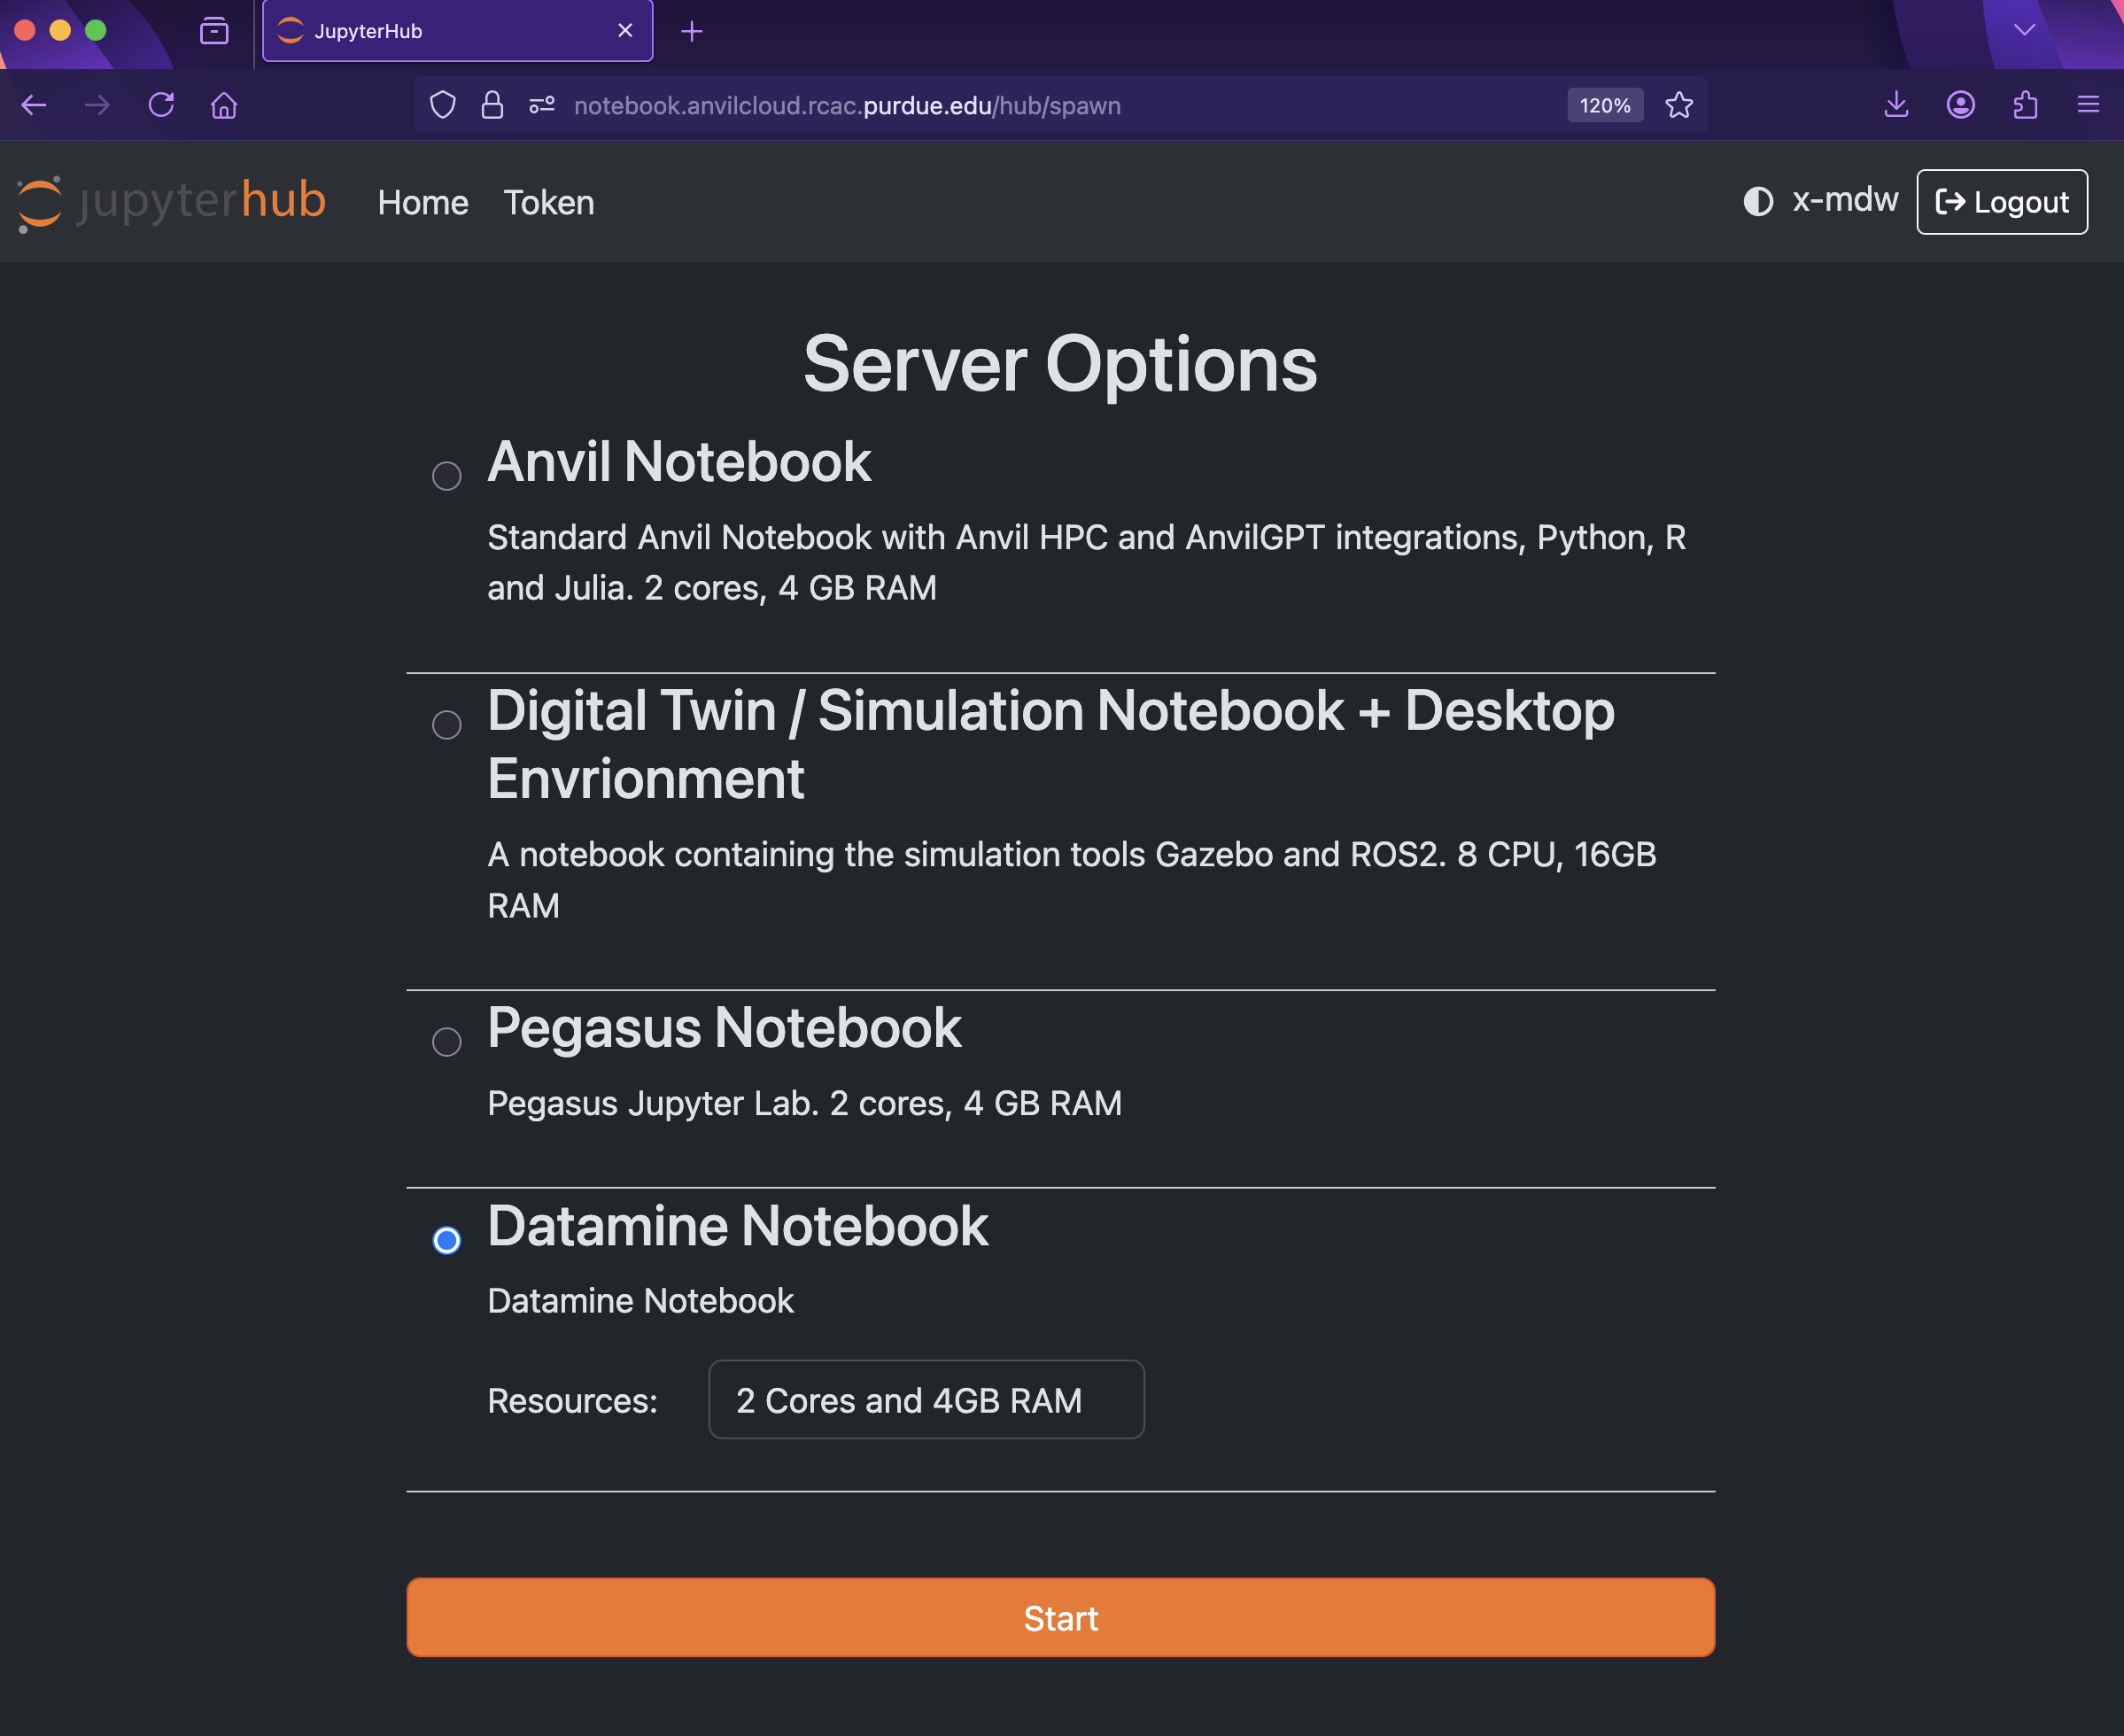
Figure 1. Server Options for Jupyter Lab
There are a few key parts of this screen to note:
With the key parts of this screen explained, go ahead and start Datamine Notebook and click the orange Start button! After a bit of waiting, you should see something like below while you are waiting for just a few seconds (sometimes it is fast and you will not even see this!) 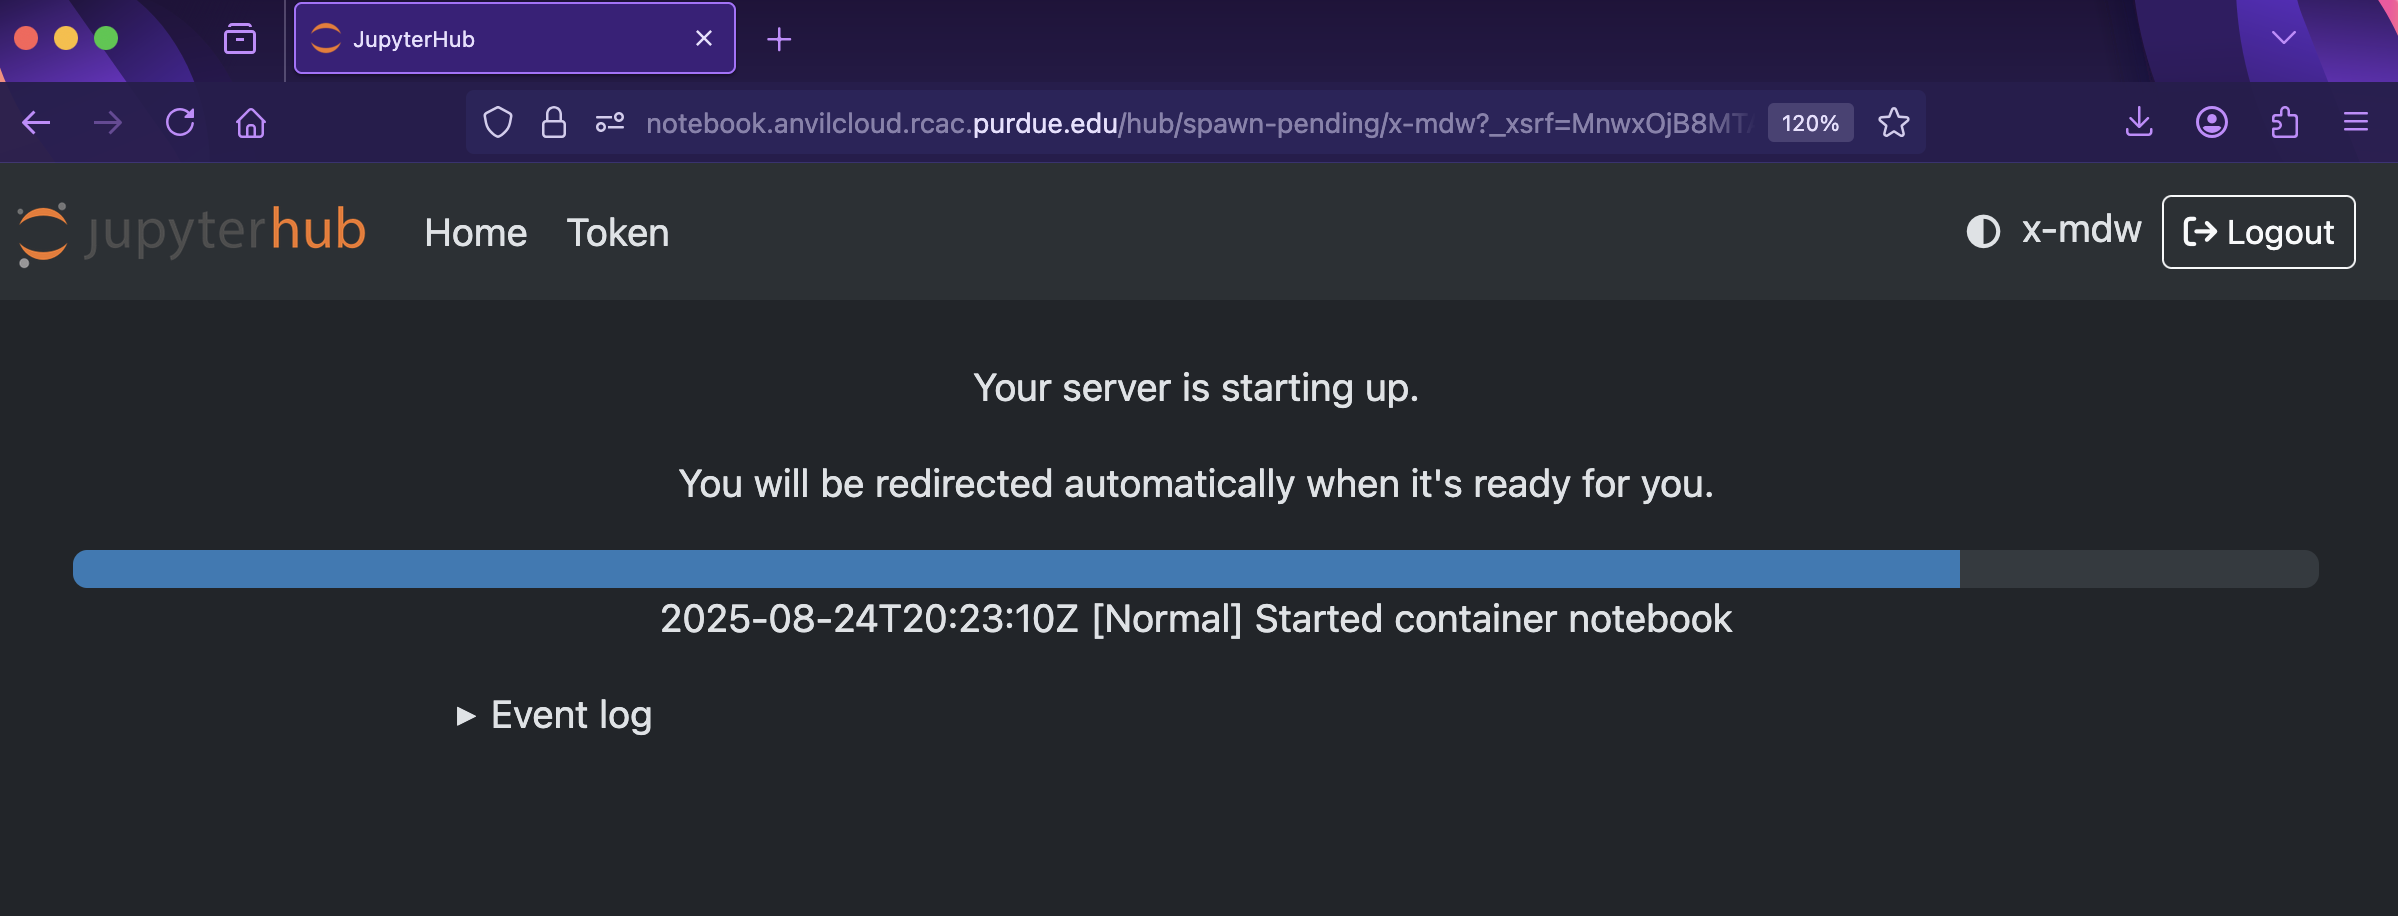
Figure 2. Launch Jupyter Lab
and then, when the Jupyter Lab is ready for you to work, you will see this: 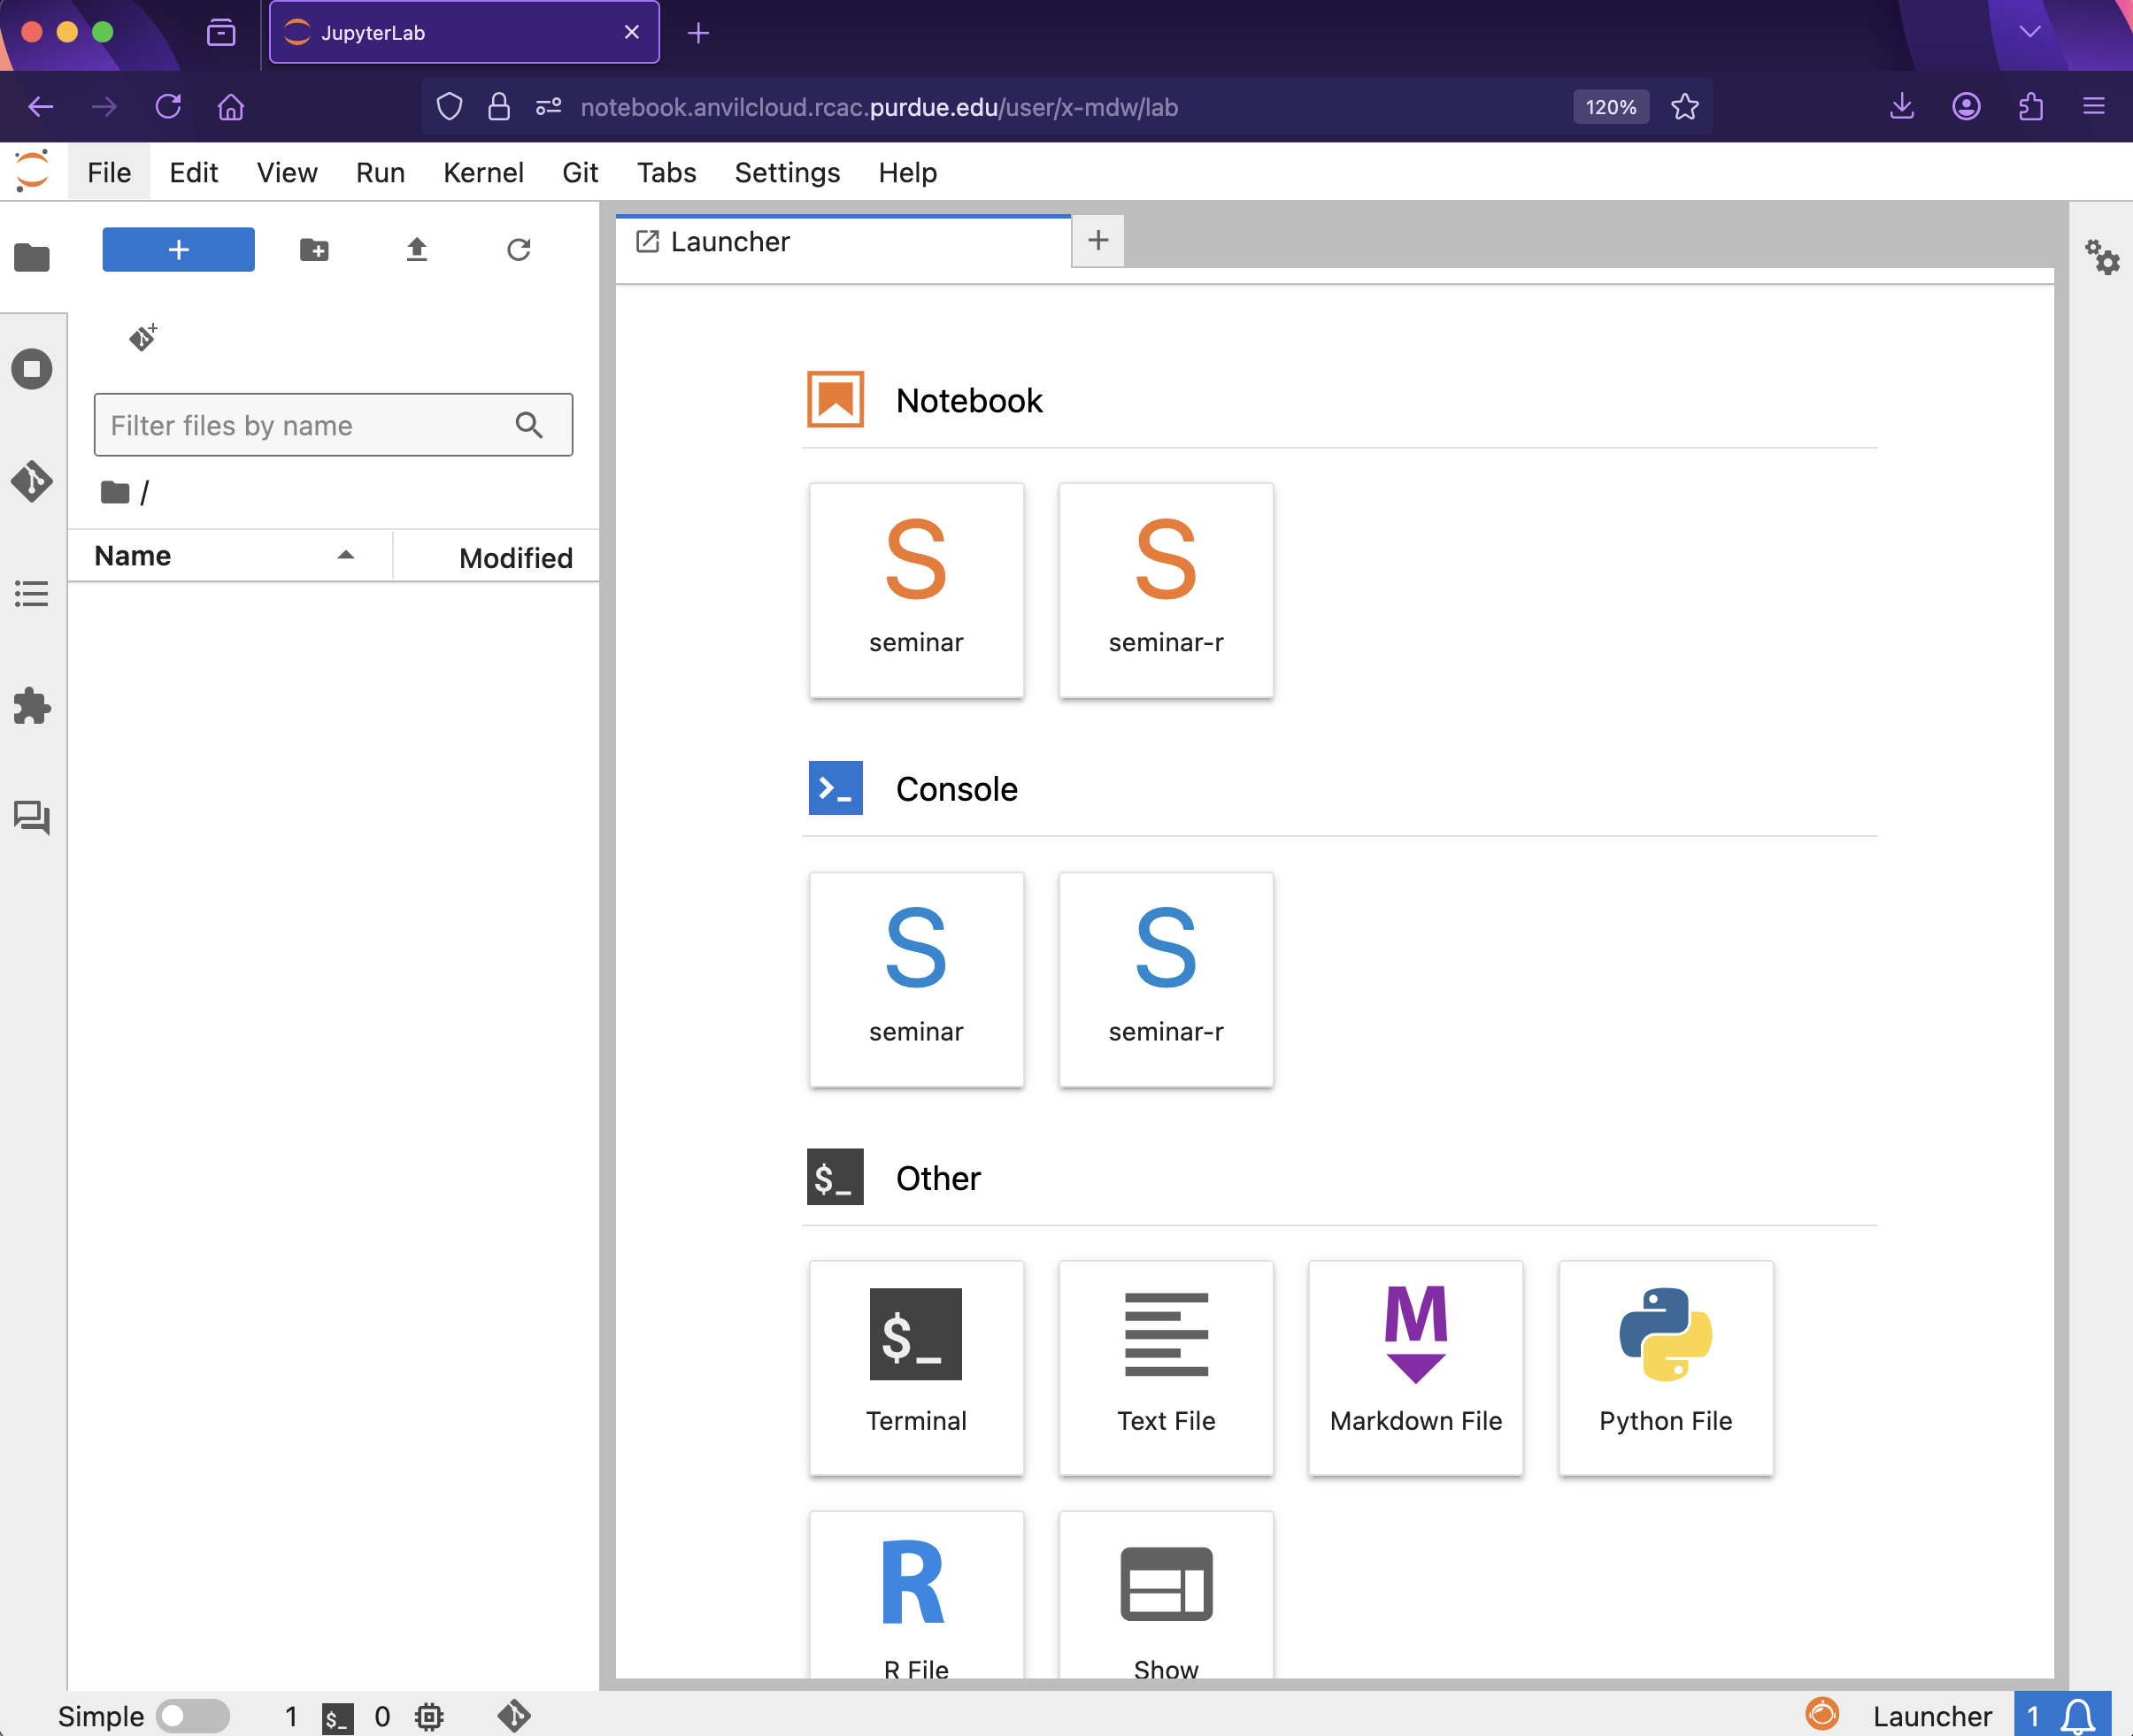
Figure 3. Jupyter Lab
|
We can use bash in Jupyter Lab (with the seminar kernel with with %%bash for cell magic), and also in the Terminal.
For a more in-depth reminder on working in Jupyter Lab, and also what changed from last year’s environment
to this year’s environment:
you can look at this year’s TDM 10100 project 1 which goes slowly through the basic steps, and/or you can check out this guide on Jupyter.
In a Jupyter Lab cell, try the following:
%%bash

echo Hello World!
The first line, %%bash, is cell magic, which tells the seminar kernel to expect a different language than the default. (In this case, the default is Python, and we are telling it to use bash instead.) When using cell magic, it is necessary to have the cell magic as the first line in the cell. If (for instance) a comment is the first thing in the cell, then the cell magic will fail; that is a common source of errors!
The second line consists of echo Hello World!. echo is a Bash command similar to print() in Python, and we have it print "Hello World!"
As for Bash (short for Bourne-Again-SHell), bash has a lot of handy tools and commands to learn. This project is an introduction to learning about working with data in bash.
The terminal is what we call the area we typically work with the CLI in. While we can run Bash in our Jupyter notebook (as we did above), you will typically work directly in a terminal. It may be helpful to first run your bash code in a terminal before copying the finished code over to your Jupyter notebook. To open a terminal on Anvil, open a new tab and select Terminal, where you’ll be greeted with a window that looks somewhat like the following (although mdw will be replaced by your access username).
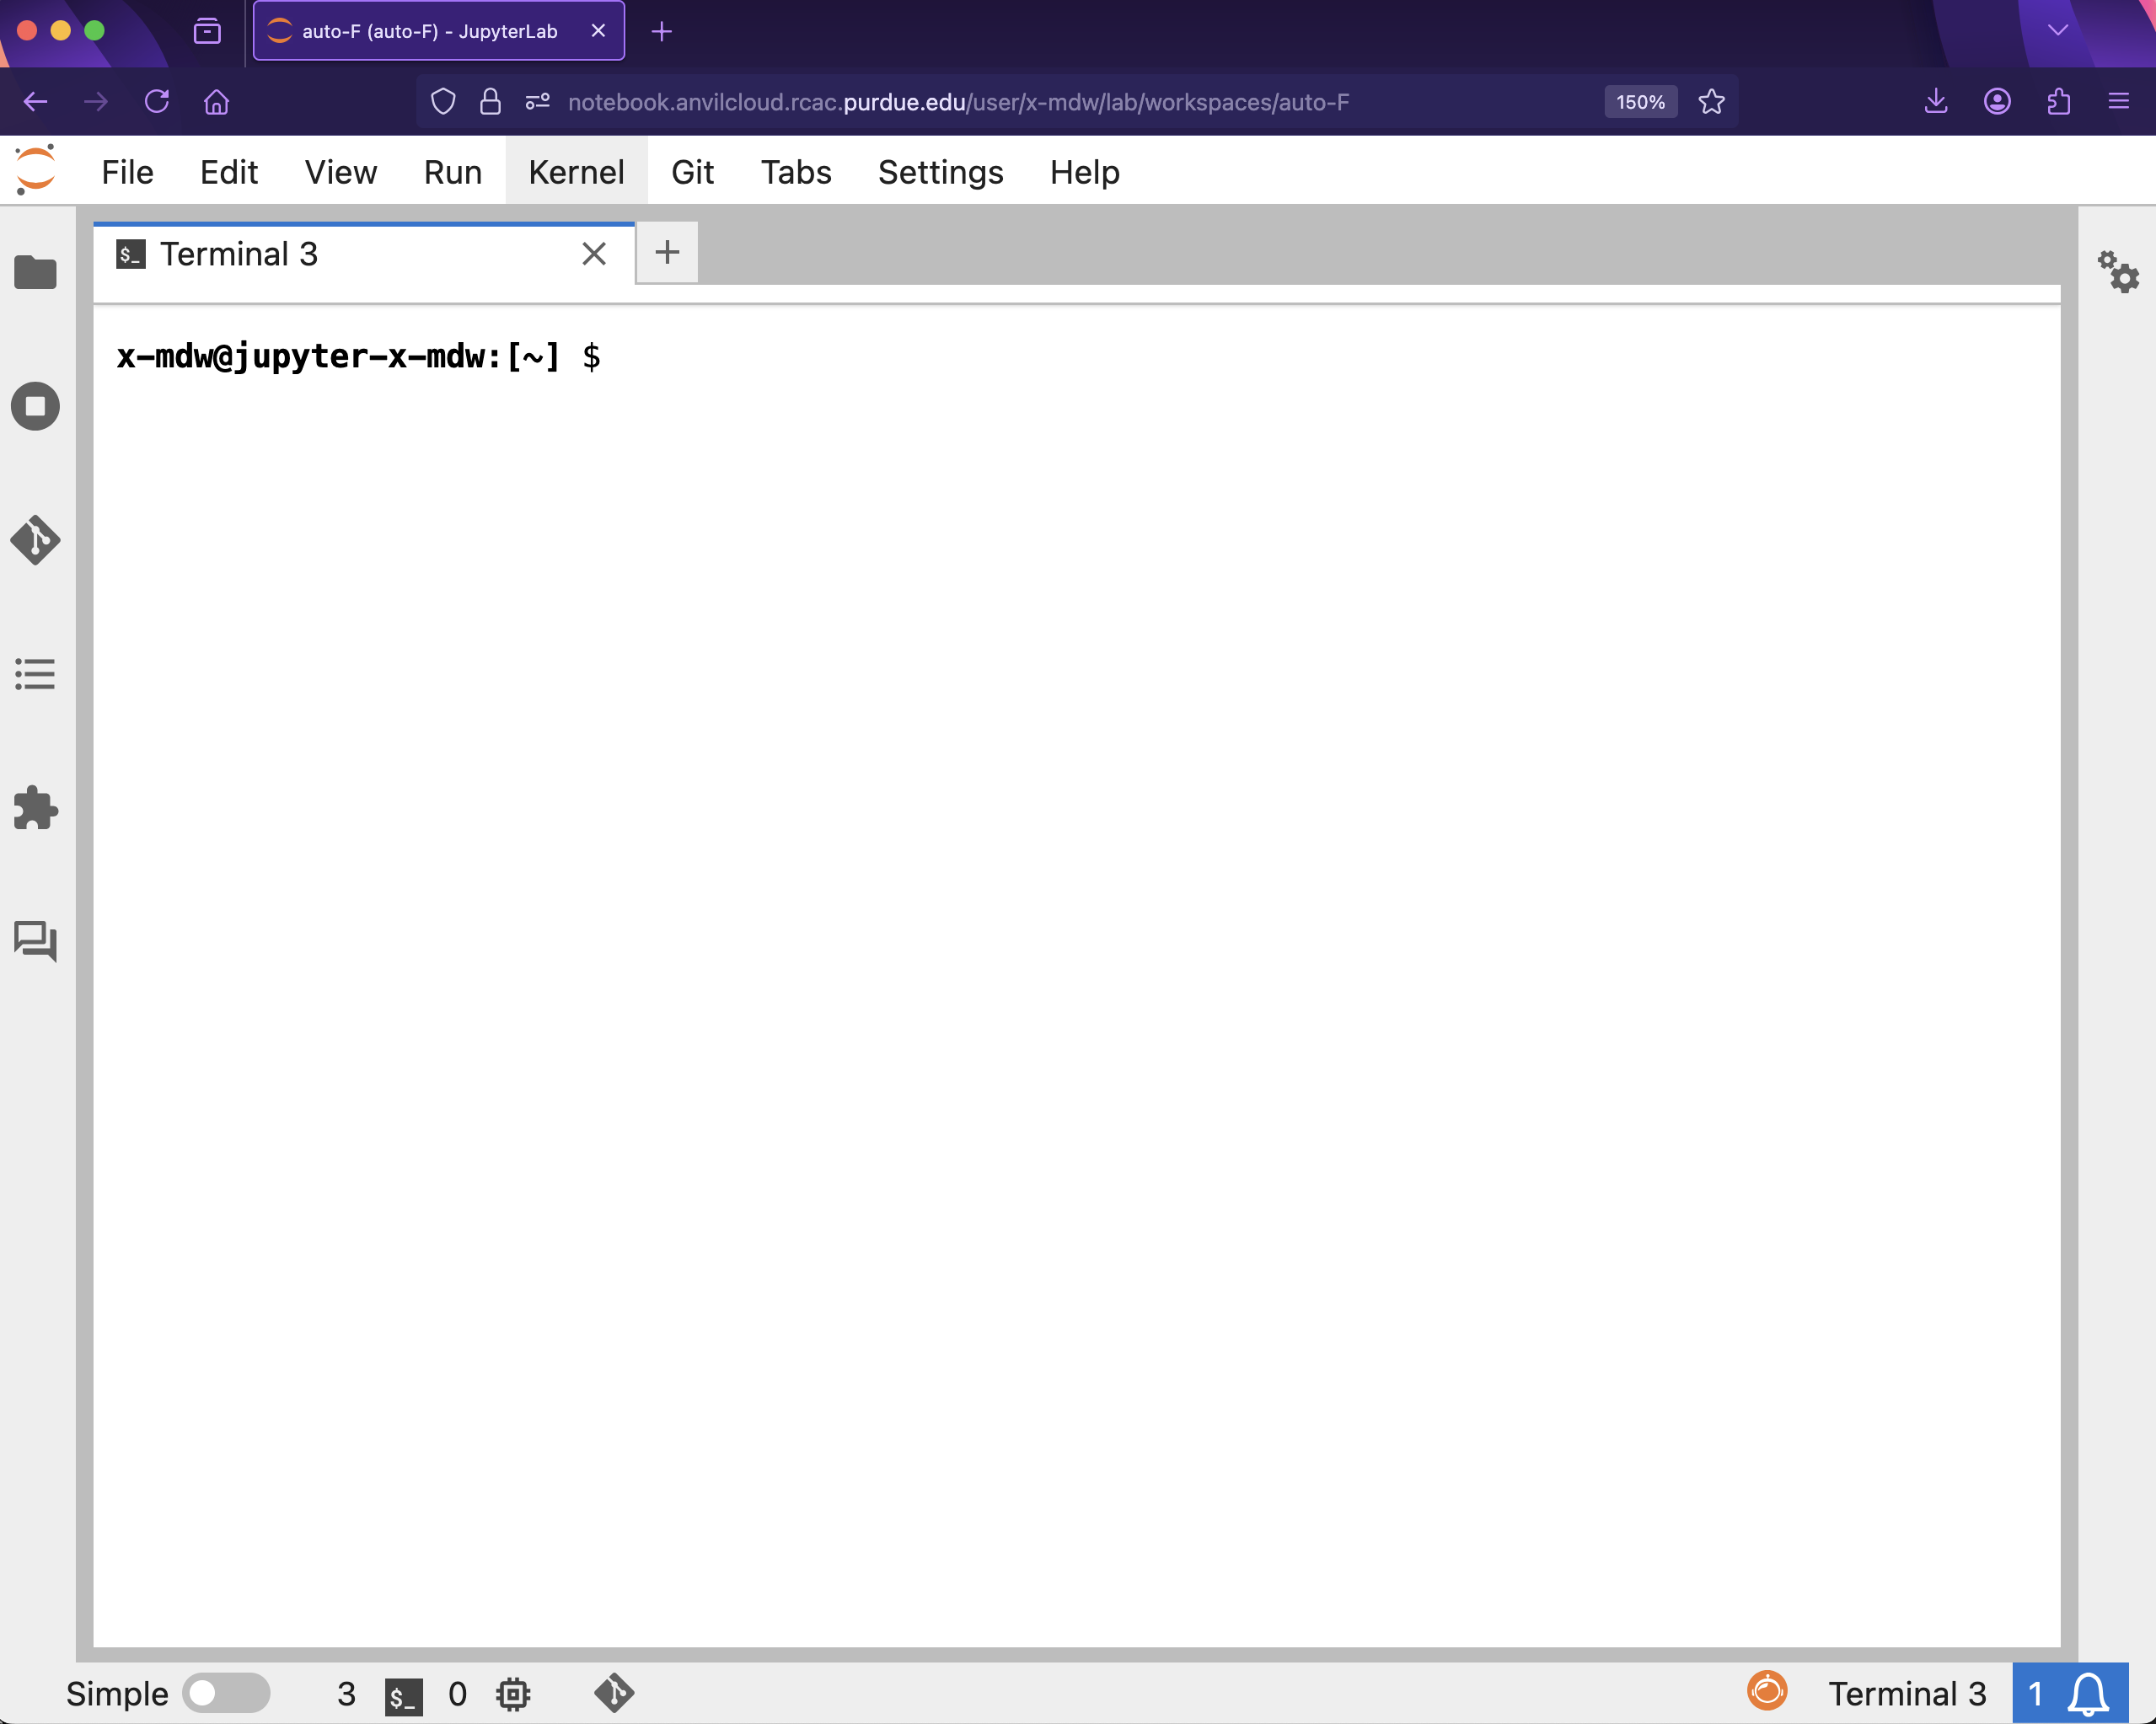
Try typing echo Hello World! and hitting enter. You should see the terminal print "Hello World!" before waiting for another command.
Questions
Question 1 (2 pts)
To start a new session on Anvil, please note that we are using notebook.anvilcloud.rcac.purdue.edu this year, instead of last year’s URL ondemand.anvil.rcac.purdue.edu/
In the file:
/anvil/projects/tdm/data/bay_area_bike_share/kaggle/status.csv
How many columns of data are there?
How big is this file?
-
How many columns of data are in the Bay Area
status.csvfile from Kaggle? -
How large is that
status.csvfile? -
Be sure to document your work from Question 1, using some comments and insights about your work.
Question 2 (2 pts)
The cd command changes directory.
The pwd command prints the working directory.
The ls command prints the contents of the working directory, with only the file names.
Dr Ward likes to run ls -la (those are lowercase letter L’s, not number 1’s), which shows information about the files in the directories.
Dr Ward also uses pwd a lot, to make sure that he is working in the directory that he intended to be working in.
|
Each bash cell in Jupyter Lab is executed independently, starting from your home directory, as if nothing had been previously run. In other words, bash cells in Jupyter Lab ignore anything that you did in earlier cells. |
Which months and years are represented in the directory (be careful; the first year that is represented has only 1 file for the whole year)?
/anvil/projects/tdm/data/bay_area_bike_share/baywheels
Which years are represented in the directory
/anvil/projects/tdm/data/election
For comparison, you can see how Dr Ward found the years for some airline data sets here:
-
Which months and years are represented in the directory (be careful; the first year that is represented has only 1 file for the whole year)?
/anvil/projects/tdm/data/bay_area_bike_share/baywheels -
Which years are represented in the directory
/anvil/projects/tdm/data/election -
Be sure to document your work from Question 2, using some comments and insights about your work.
Question 3 (2 pts)
We can use the head and the tail commands to see the top lines and the bottom lines of a file. By default, we see 10 lines of output, in each case. We can use the -n flag to change the number of lines of output that we see. For instance:
%%bash

head -n6 /anvil/projects/tdm/data/bay_area_bike_share/kaggle/trip.csv
shows the first 6 lines of the trip.csv file for the Bay Area status.csv file from Kaggle. This includes the header line and also the information about the first 5 trips.
The cut command usually takes two flags, namely:
the -d flag that indicates how the data in a flag is delimited (in other words, what character is placed between the pieces of data), and
the -f flag that indicates which fields we want to cut.
Use the cut command to extract all of the values of the start_station_name and end_station_name data from this file, and store the resulting start_station_name and end_station_name data into a file in your home directory. Each line should have 1 starting station name, followed by a comma, followed by 1 ending station name.
You can save the results of your work in bash in a file in your home directory like this:
%%bash
myworkinbash >$HOME/startandendlocations.csv
Dr Ward did an example last year with airline data, which might help to guide your work:
-
Show the head of the file
startandendlocations.csvthat you created. -
Be sure to document your work from Question 3, using some comments and insights about your work.
Question 4 (2 pts)
Use the grep command to find data in the trip.csv file that contains the pattern "Van Ness". Save all of the lines of the trip.csv file into a new file in your home directory called vanness.csv.
For comparison, Dr Ward did this last year with Indianapolis flights for some airplane data:
-
Show the head of the file
vanness.csvthat you created. -
Be sure to document your work from Question 4, using some comments and insights about your work.
Question 5 (2 pts)
Now consider the file:
/anvil/projects/tdm/data/bay_area_bike_share/kaggle/status.csv
There are stations numbered from 2 through 84.
How many lines correpond to data from station 2?
How many lines correpond to data from station 3?
How many lines correpond to data from station 4?
How many lines correpond to data from station 5?
(Later, we will learn how to do this in a more automated way, and also in such a way that we can handle all stations from 2 through 84.)
-
How many lines of the
status.csvfile correpond to data from station 2? -
How many lines of the
status.csvfile correpond to data from station 3? -
How many lines of the
status.csvfile correpond to data from station 4? -
How many lines of the
status.csvfile correpond to data from station 5? -
Be sure to document your work from Question 5, using some comments and insights about your work.
Submitting your Work
Please make sure that you added comments for each question, which explain your thinking about your method of solving each question. Please also make sure that your work is your own work, and that any outside sources (people, internet pages, generative AI, etc.) are cited properly in the project template.
Congratulations! Assuming you’ve completed all the above questions, you’ve just finished your first project for TDM 20100! If you have any questions or issues regarding this project, please feel free to ask in seminar, over Piazza, or during office hours.
Prior to submitting your work, you need to put your work into the project template, and re-run all of the code in Jupyter Lab and make sure that the results of running that code is visible in your template. Please check the detailed instructions on how to ensure that your submission is formatted correctly. To download your completed project, you can right-click on the file in the file explorer and click 'download'.
Once you upload your submission to Gradescope, make sure that everything appears as you would expect to ensure that you don’t lose any points. We hope your first project with us went well, and we look forward to continuing to learn with you on future projects!!
-
firstname_lastname_project1.ipynb
|
It is necessary to document your work, with comments about each solution. All of your work needs to be your own work, with citations to any source that you used. Please make sure that your work is your own work, and that any outside sources (people, internet pages, generative AI, etc.) are cited properly in the project template. You must double check your Please take the time to double check your work. See here for instructions on how to double check this. You will not receive full credit if your |