TDM 30100: Project 1 — Python Review
Motivation: We have used Python for data wrangling, but it has been a long summer, and we want to review some basic Python skills.
Context: We are moving to a new URL for Anvil and want to get familiar with this environment during week 1.
Scope: Anvil, Jupyter Lab, Python review
Dataset(s)
This project will use the following dataset(s):
-
/anvil/projects/tdm/data/bay_area_bike_share/kaggle/ -
/anvil/projects/tdm/data/bay_area_bike_share/baywheels
In case you haven’t done this already, visit the new Anvil website notebook.anvilcloud.rcac.purdue.edu and log in using your ACCESS account credentials. If you don’t already have an account, follow these instructions to set one up. If you’ve forgotten your account credentials or are having other issues related to Anvil, please reach out to [email protected] with as much information as possible about your issue.
|
Your ACCESS account credentials may not necessarily be the same as your Purdue Career account. |
Once logged in, start a new Anvil session with 2 Cores and 4GB RAM. In the new Anvil website, you do not have a pre-defined time limit for your session. Anvil will automatically log you out when you have not worked in the Jupyter Lab for a given period of time (something like 15 or 20 minutes).
|
To start a new session on Anvil, please note that we are using notebook.anvilcloud.rcac.purdue.edu this year, instead of last year’s URL ondemand.anvil.rcac.purdue.edu/ You should now be on a screen that looks like this: 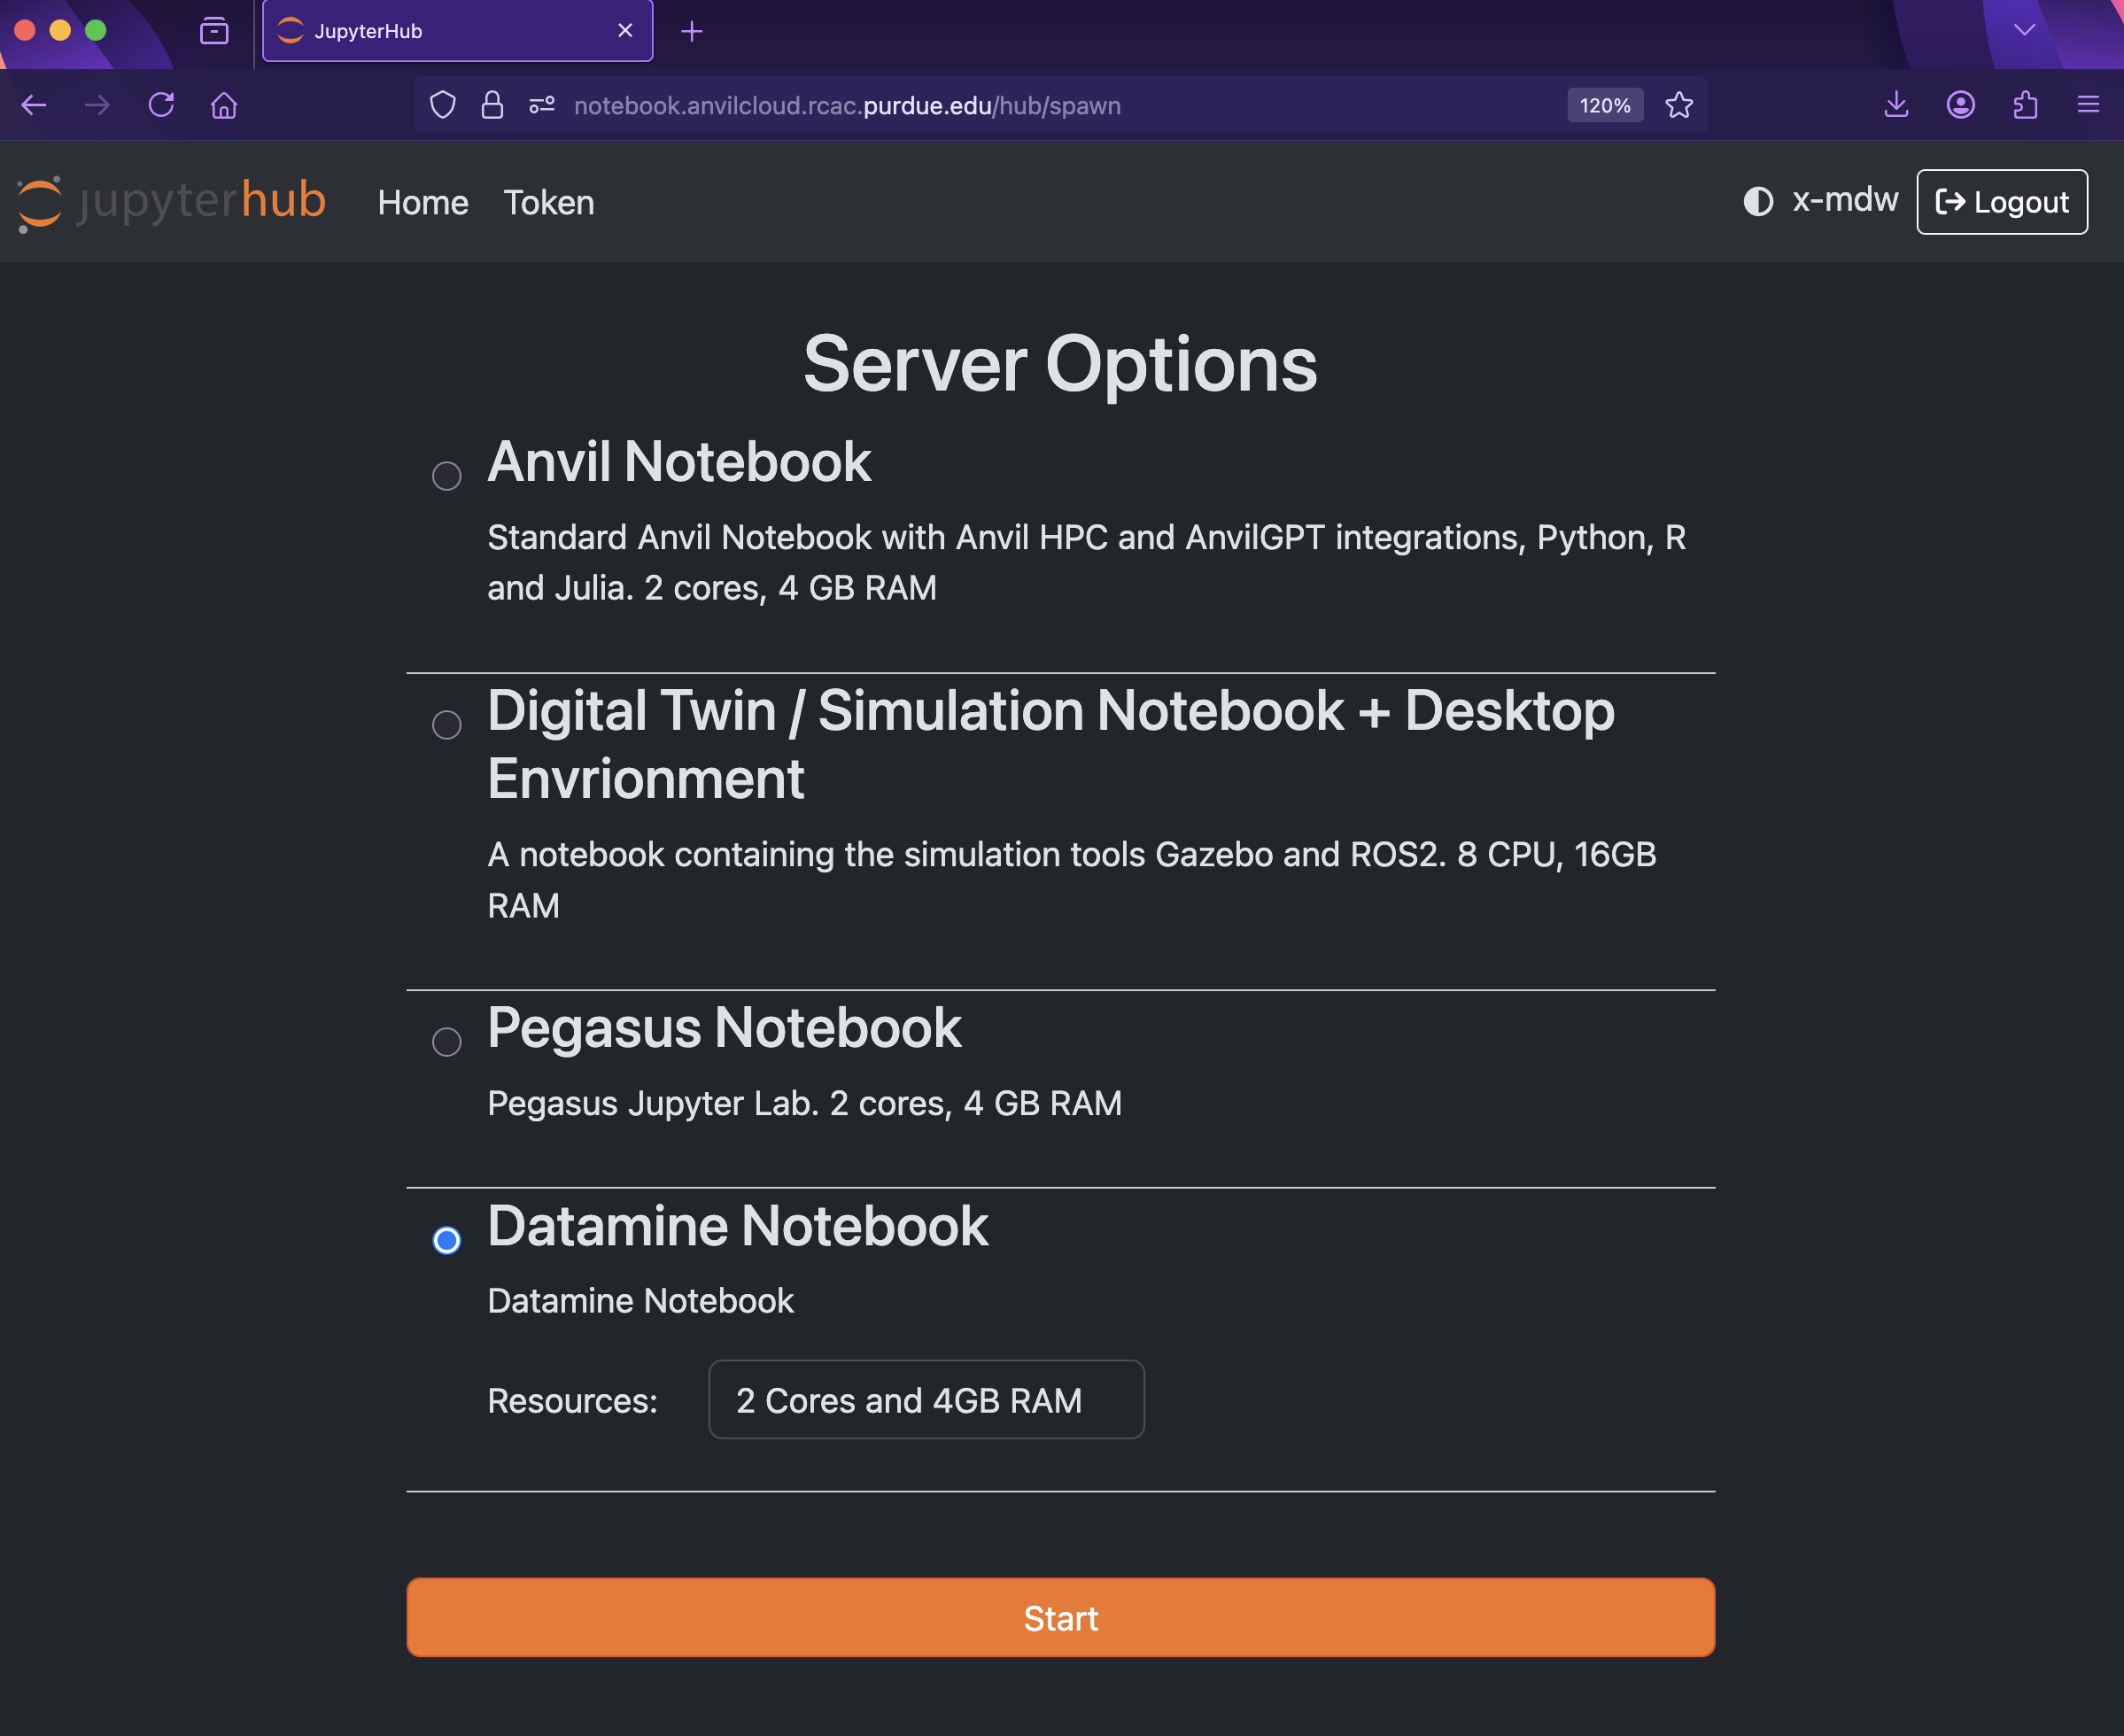
Figure 1. Server Options for Jupyter Lab
There are a few key parts of this screen to note:
With the key parts of this screen explained, go ahead and start Datamine Notebook and click the orange Start button! After a bit of waiting, you should see something like below while you are waiting for just a few seconds (sometimes it is fast and you will not even see this!) 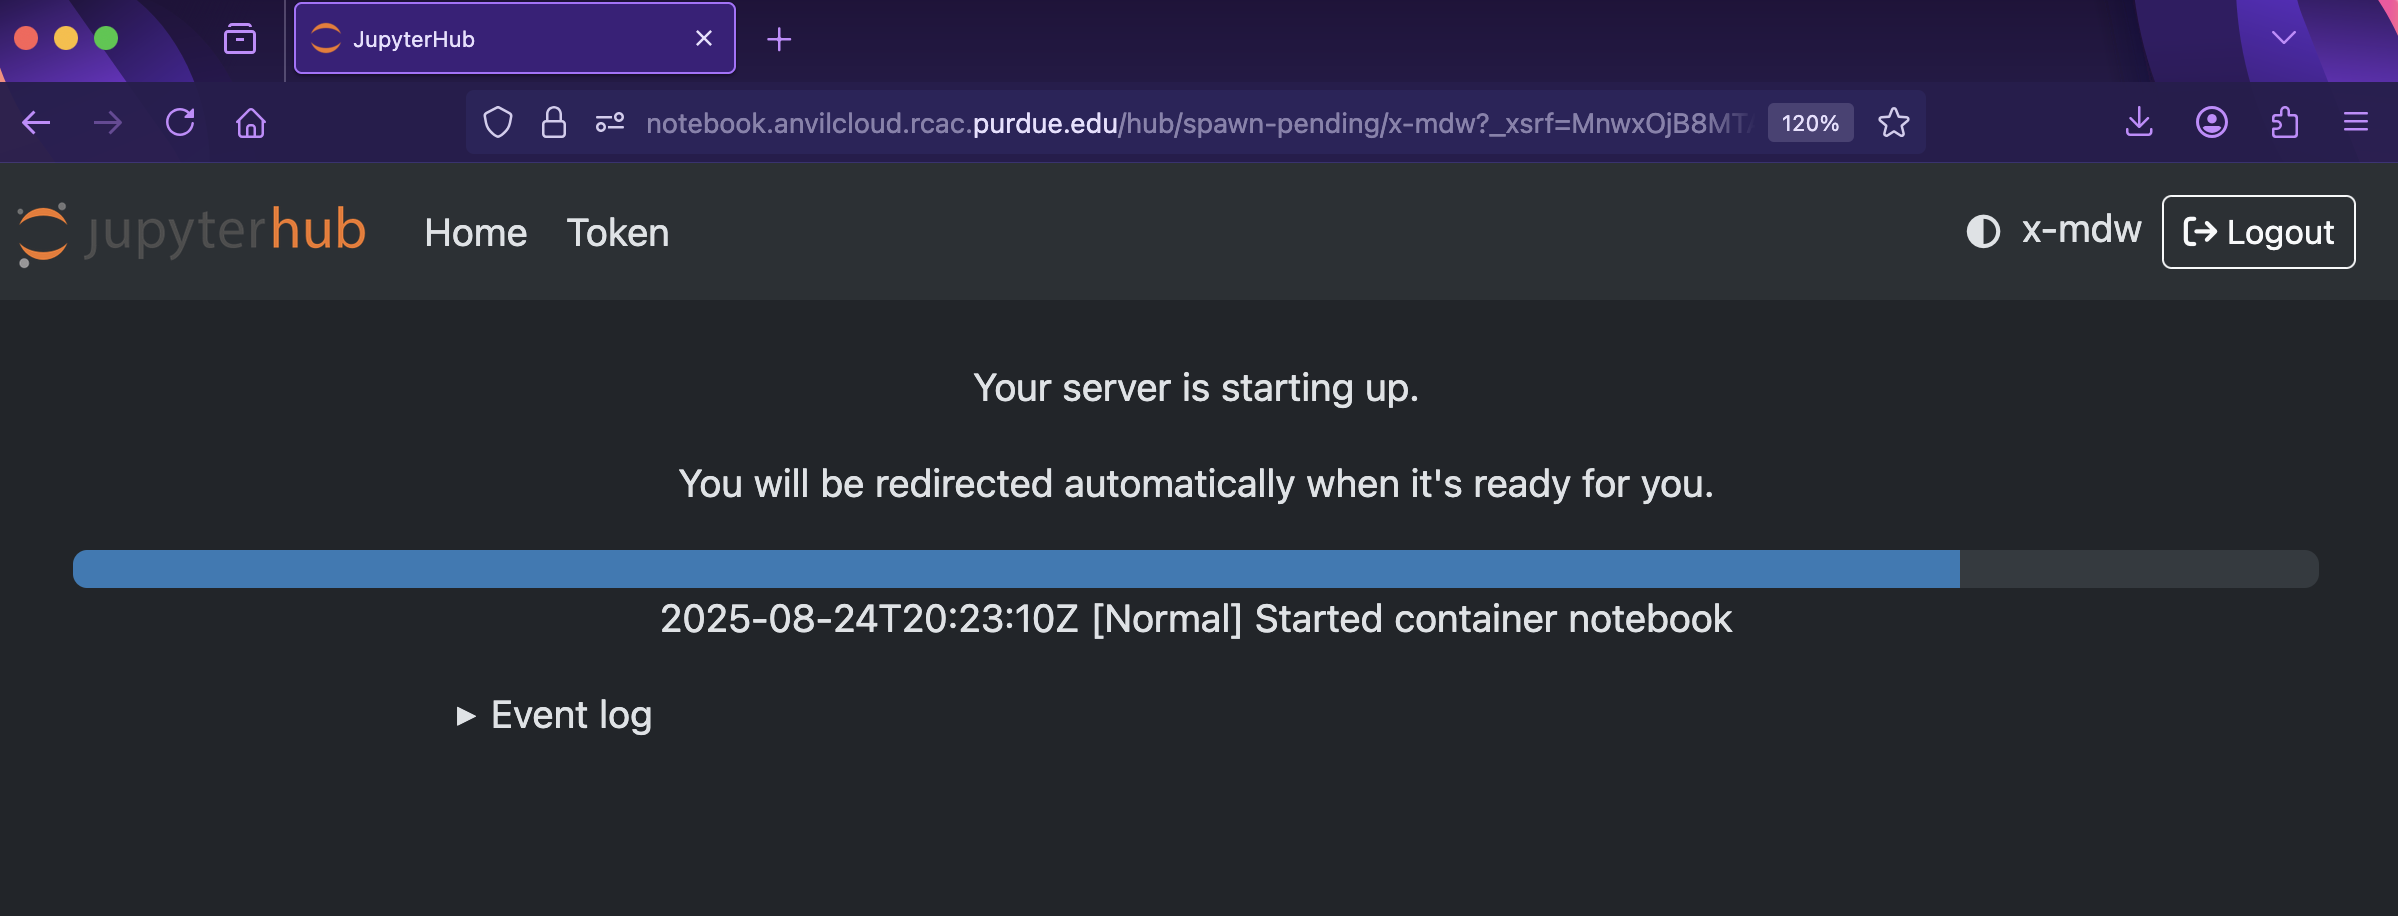
Figure 2. Launch Jupyter Lab
and then, when the Jupyter Lab is ready for you to work, you will see this: 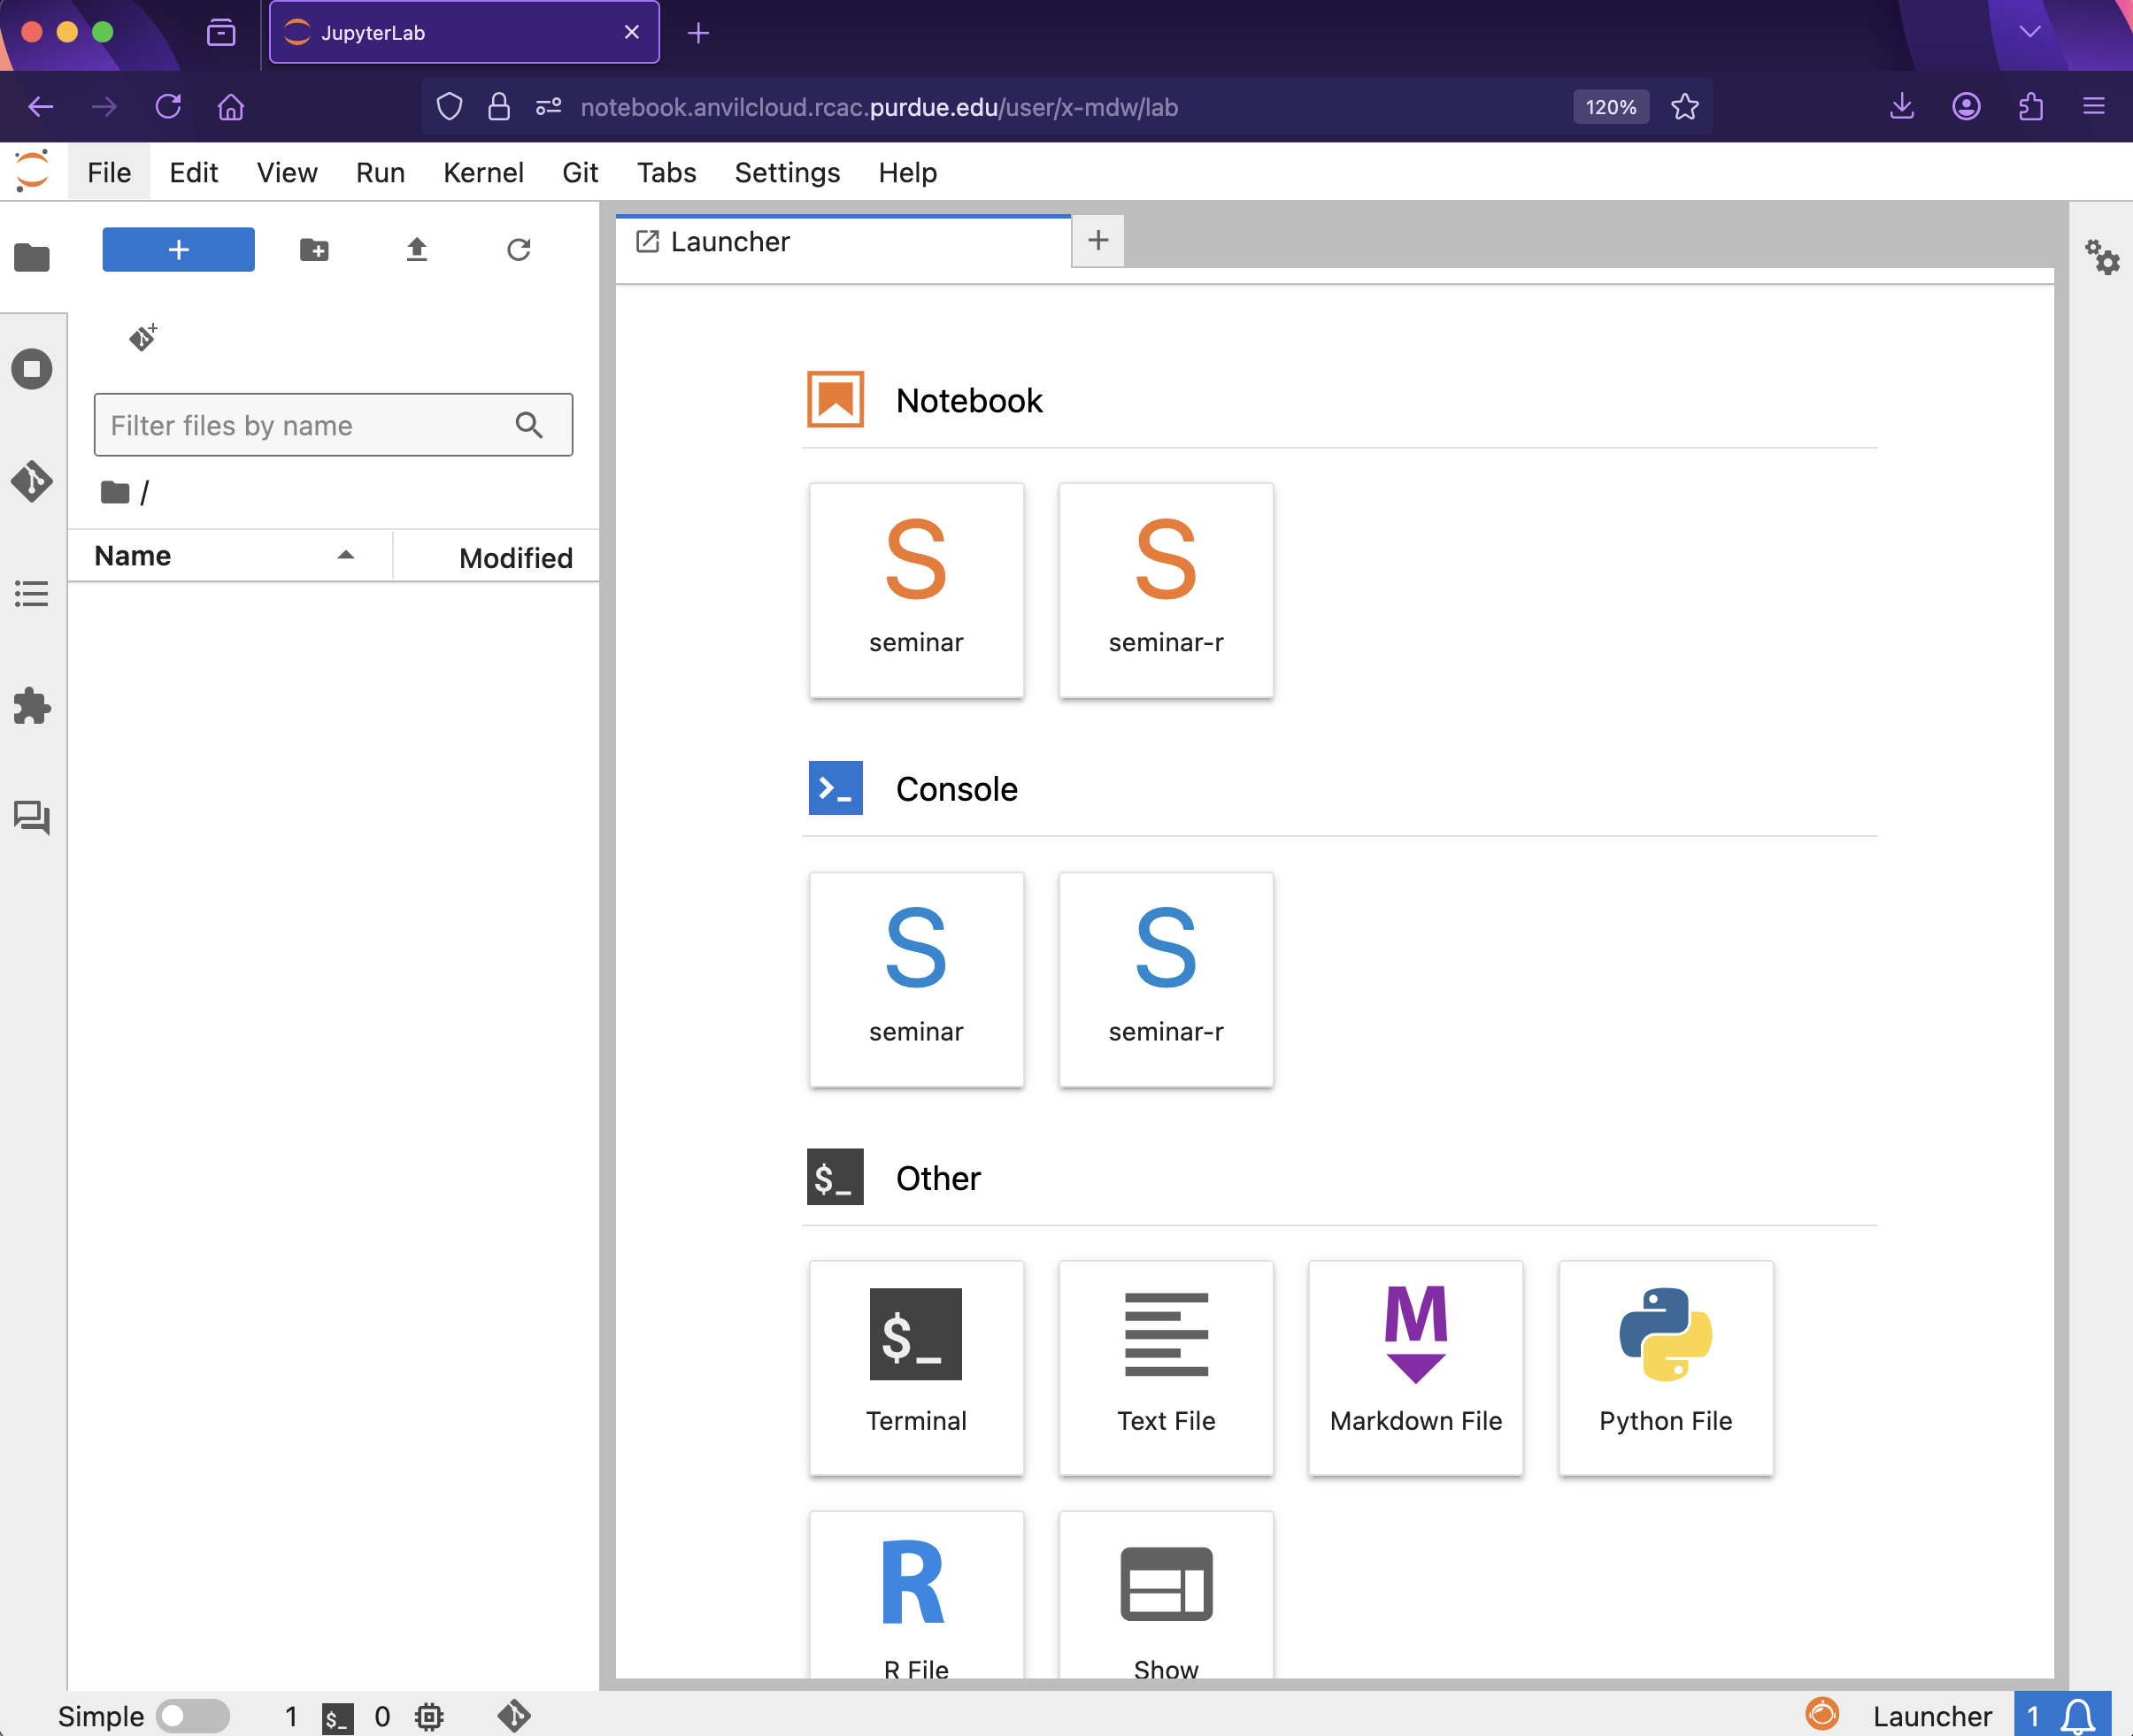
Figure 3. Jupyter Lab
|
For a more in-depth reminder on working in Jupyter Lab, and also what changed from last year’s environment
to this year’s environment:
you can look at this year’s TDM 10100 project 1 which goes slowly through the basic steps, and/or you can check out this guide on Jupyter.
Questions
Question 1 (2 pts)
Write a Python function that takes a two-digit number representing any of the twelve months "01" through "12" as input. Your function should read in the file from the year 2018 for that month in the directory
/anvil/projects/tdm/data/bay_area_bike_share/baywheels/ and should display the number of lines corresponding to Subscriber for user_type and also should display the number lines corresponding to Customer for user_type.
Demonstrate how your function works for August 2018. If you run myusertypefunction("08") then your function should indicate that there are 161443 Subscribers and 30719 Customers.
Try your function for a few different months in 2018.
-
Create a Python function that can read in a month of data as indicated by a 2-digit string given as input to the function, and can determine how many lines of data are for subscribers and how many lines of data are for users.
-
Demonstrate that the function works, by running your function for a few different months.
-
Be sure to document your work from Question 1, using some comments and insights about your work.
Question 2 (2 pts)
Modify your function from Question 1 to return only the number of lines of data for subscribers (not customers).
Then use a list comprehension on the numbers from 1 to 12 to run this new function for all 12 months in 2018. For instance, you might run something like this:
[mynewfunction("{:02d}".format(i)) for i in range(1,13)]-
Use a list comprehension to extract the number of lines of data from each month in 2018 for subscribers (not customers).
-
Be sure to document your work from Question 2, using some comments and insights about your work.
Question 3 (2 pts)
Use matplotlib to make a plot of the results from Question 2, i.e., showing the number of lines of data for subscribers (not customers) in each month in 2018. The x-axis should correspond to the months and the y-axis should correspond to the number of lines of data for subscribers (not customers) in each month in 2018.
-
Use matplotlib to make a plot of the results from Question 2.
-
Be sure to document your work from Question 3, using some comments and insights about your work.
Question 4 (2 pts)
For questions 4 and 5, we are no longer limited to the year 2018.
For each of the files in the directory
/anvil/projects/tdm/data/bay_area_bike_share/baywheels/
there is a start_station_name and an end_station_name. Consider a pair of starting and ending stations to be a path (this word path is Dr Ward’s word; the word path is not a column in the files).
Write a function that takes a file name as input, and finds the five most popular paths in the file. In other words, given a file name, your function should find the pair of starting and ending stations that occur (on the same line, as a pair) the greatest number of times in the file.
(It is up to you whether you want to include blank entries.)
-
Write a function that takes a file name as input, and finds the five most popular paths in the file.
-
Be sure to document your work from Question 4, using some comments and insights about your work.
Question 5 (2 pts)
Test the function that you wrote in Question 4 for the data from May 2025, and agian for the data from June 2025, and again for the data from July 2025.
-
You should print the most 5 popular paths for May 2025.
-
Then you should print the most 5 popular paths for June 2025.
-
Finally, you should print the most 5 popular paths for July 2025.
-
Be sure to document your work from Question 5, using some comments and insights about your work.
Submitting your Work
Please make sure that you added comments for each question, which explain your thinking about your method of solving each question. Please also make sure that your work is your own work, and that any outside sources (people, internet pages, generative AI, etc.) are cited properly in the project template.
Congratulations! Assuming you’ve completed all the above questions, you’ve just finished your first project for TDM 30100! If you have any questions or issues regarding this project, please feel free to ask in seminar, over Piazza, or during office hours.
Prior to submitting your work, you need to put your work into the project template, and re-run all of the code in Jupyter Lab and make sure that the results of running that code is visible in your template. Please check the detailed instructions on how to ensure that your submission is formatted correctly. To download your completed project, you can right-click on the file in the file explorer and click 'download'.
Once you upload your submission to Gradescope, make sure that everything appears as you would expect to ensure that you don’t lose any points. We hope your first project with us went well, and we look forward to continuing to learn with you on future projects!!
-
firstname_lastname_project1.ipynb
|
It is necessary to document your work, with comments about each solution. All of your work needs to be your own work, with citations to any source that you used. Please make sure that your work is your own work, and that any outside sources (people, internet pages, generative AI, etc.) are cited properly in the project template. You must double check your Please take the time to double check your work. See here for instructions on how to double check this. You will not receive full credit if your |