TDM 10200: Python Project 1 — Spring 2026
Motivation: Happy New Year! Welcome back to The Data Mine! Or, if you are new to The Data Mine in Spring 2026, welcome to you for the first time! In this project, we learn how to load data sets in Python. We will get comfortable making some simple visualizations. We use Jupyter Lab on the Anvil computational cluster. In this first project, it is OK to ask many questions and to explore! (It is always OK to ask questions.)
Context: No background knowledge in Python is needed. It is OK if you are totally new to Python, new to data analysis, etc. We will learn together, step by step, working with data in a practical way. We are "learning by doing".
Scope: Anvil, Jupyter Lab, Python
Make sure to read about, and use the template found on the template page, and the important information about project submissions on the submission page.
Dataset(s)
This project will use the following dataset(s):
-
/anvil/projects/tdm/data/flights/subset/airports.csv -
/anvil/projects/tdm/data/olympics/athlete_events.csv -
/anvil/projects/tdm/data/restaurant/vendors.csv
|
If AI is used in any cases, such as for debugging, research, etc., we now require that you submit a link to the entire chat history. For example, if you used ChatGPT, there is an “Share” option in the conversation sidebar. Click on “Create Link” and please add the shareable link as a part of your citation. The project template in the Examples Book now has a “Link to AI Chat History” section; please have this included in all your projects. If you did not use any AI tools, you may write “None”. We allow using AI for learning purposes; however, all submitted materials (code, comments, and explanations) must all be your own work and in your own words. No content or ideas should be directly applied or copy pasted to your projects. Please refer to GenAI page in the example book. Failing to follow these guidelines is considered as academic dishonesty. |
If you have already been in The Data Mine during the fall 2025 semester, you can scan quickly through this question, and simply load the head of the airports subset data, as described in the videos. If you are new in The Data Mine this spring, it should be helpful to read carefully through this question.
Welcome to The Data Mine (either "welcome back" or "welcome for the first time"!). We hope that throughout your journey with us, you learn a lot, make new friends, and develop skills that will help you with your future career. Throughout your time with The Data Mine, you will have plenty of resources available should you need help. By coming to weekly seminar, posting on the class Piazza page, and joining Dr. Ward and the TA team’s office hours, you can ensure that you always have the support you need to succeed in this course.
The links to Piazza say "Fall 2025" but we continue to use these same links for "Spring 2026" too! Do not worry, if you are new in Spring 2026, everybody is starting these topics together.
If you are a graduate student, then please click into the Piazza link at the level in which you are taking the course. Please submit a ticket, if you are unsure.
Dr Ward is also available on Monday mornings in the Hillenbrand dining court from 8:30 AM to 11:20 AM (Eastern time zone). He is also available on Monday afternoons during 4:30 PM to 5:20 PM on Zoom at https://purdue-edu.zoom.us/my/mdward/
|
If you did not (yet) set up your 2-factor authentication credentials with Duo, you can set up the credentials here: https://the-examples-book.com/setup If you are still having issues with your ACCESS ID, please send an email containing as much information as possible about your issue to [email protected] |
Let’s start off by starting up our first Jupyter session on Anvil! We always use the URL https://notebook.anvilcloud.rcac.purdue.edu and the ACCESS username that you were assigned (when you setup your account) and the ACCESS password that you chose. These are NOT the same as your Purdue account!
|
These credentials are not the same as your Purdue account. |
You should now be on a screen that looks like this:
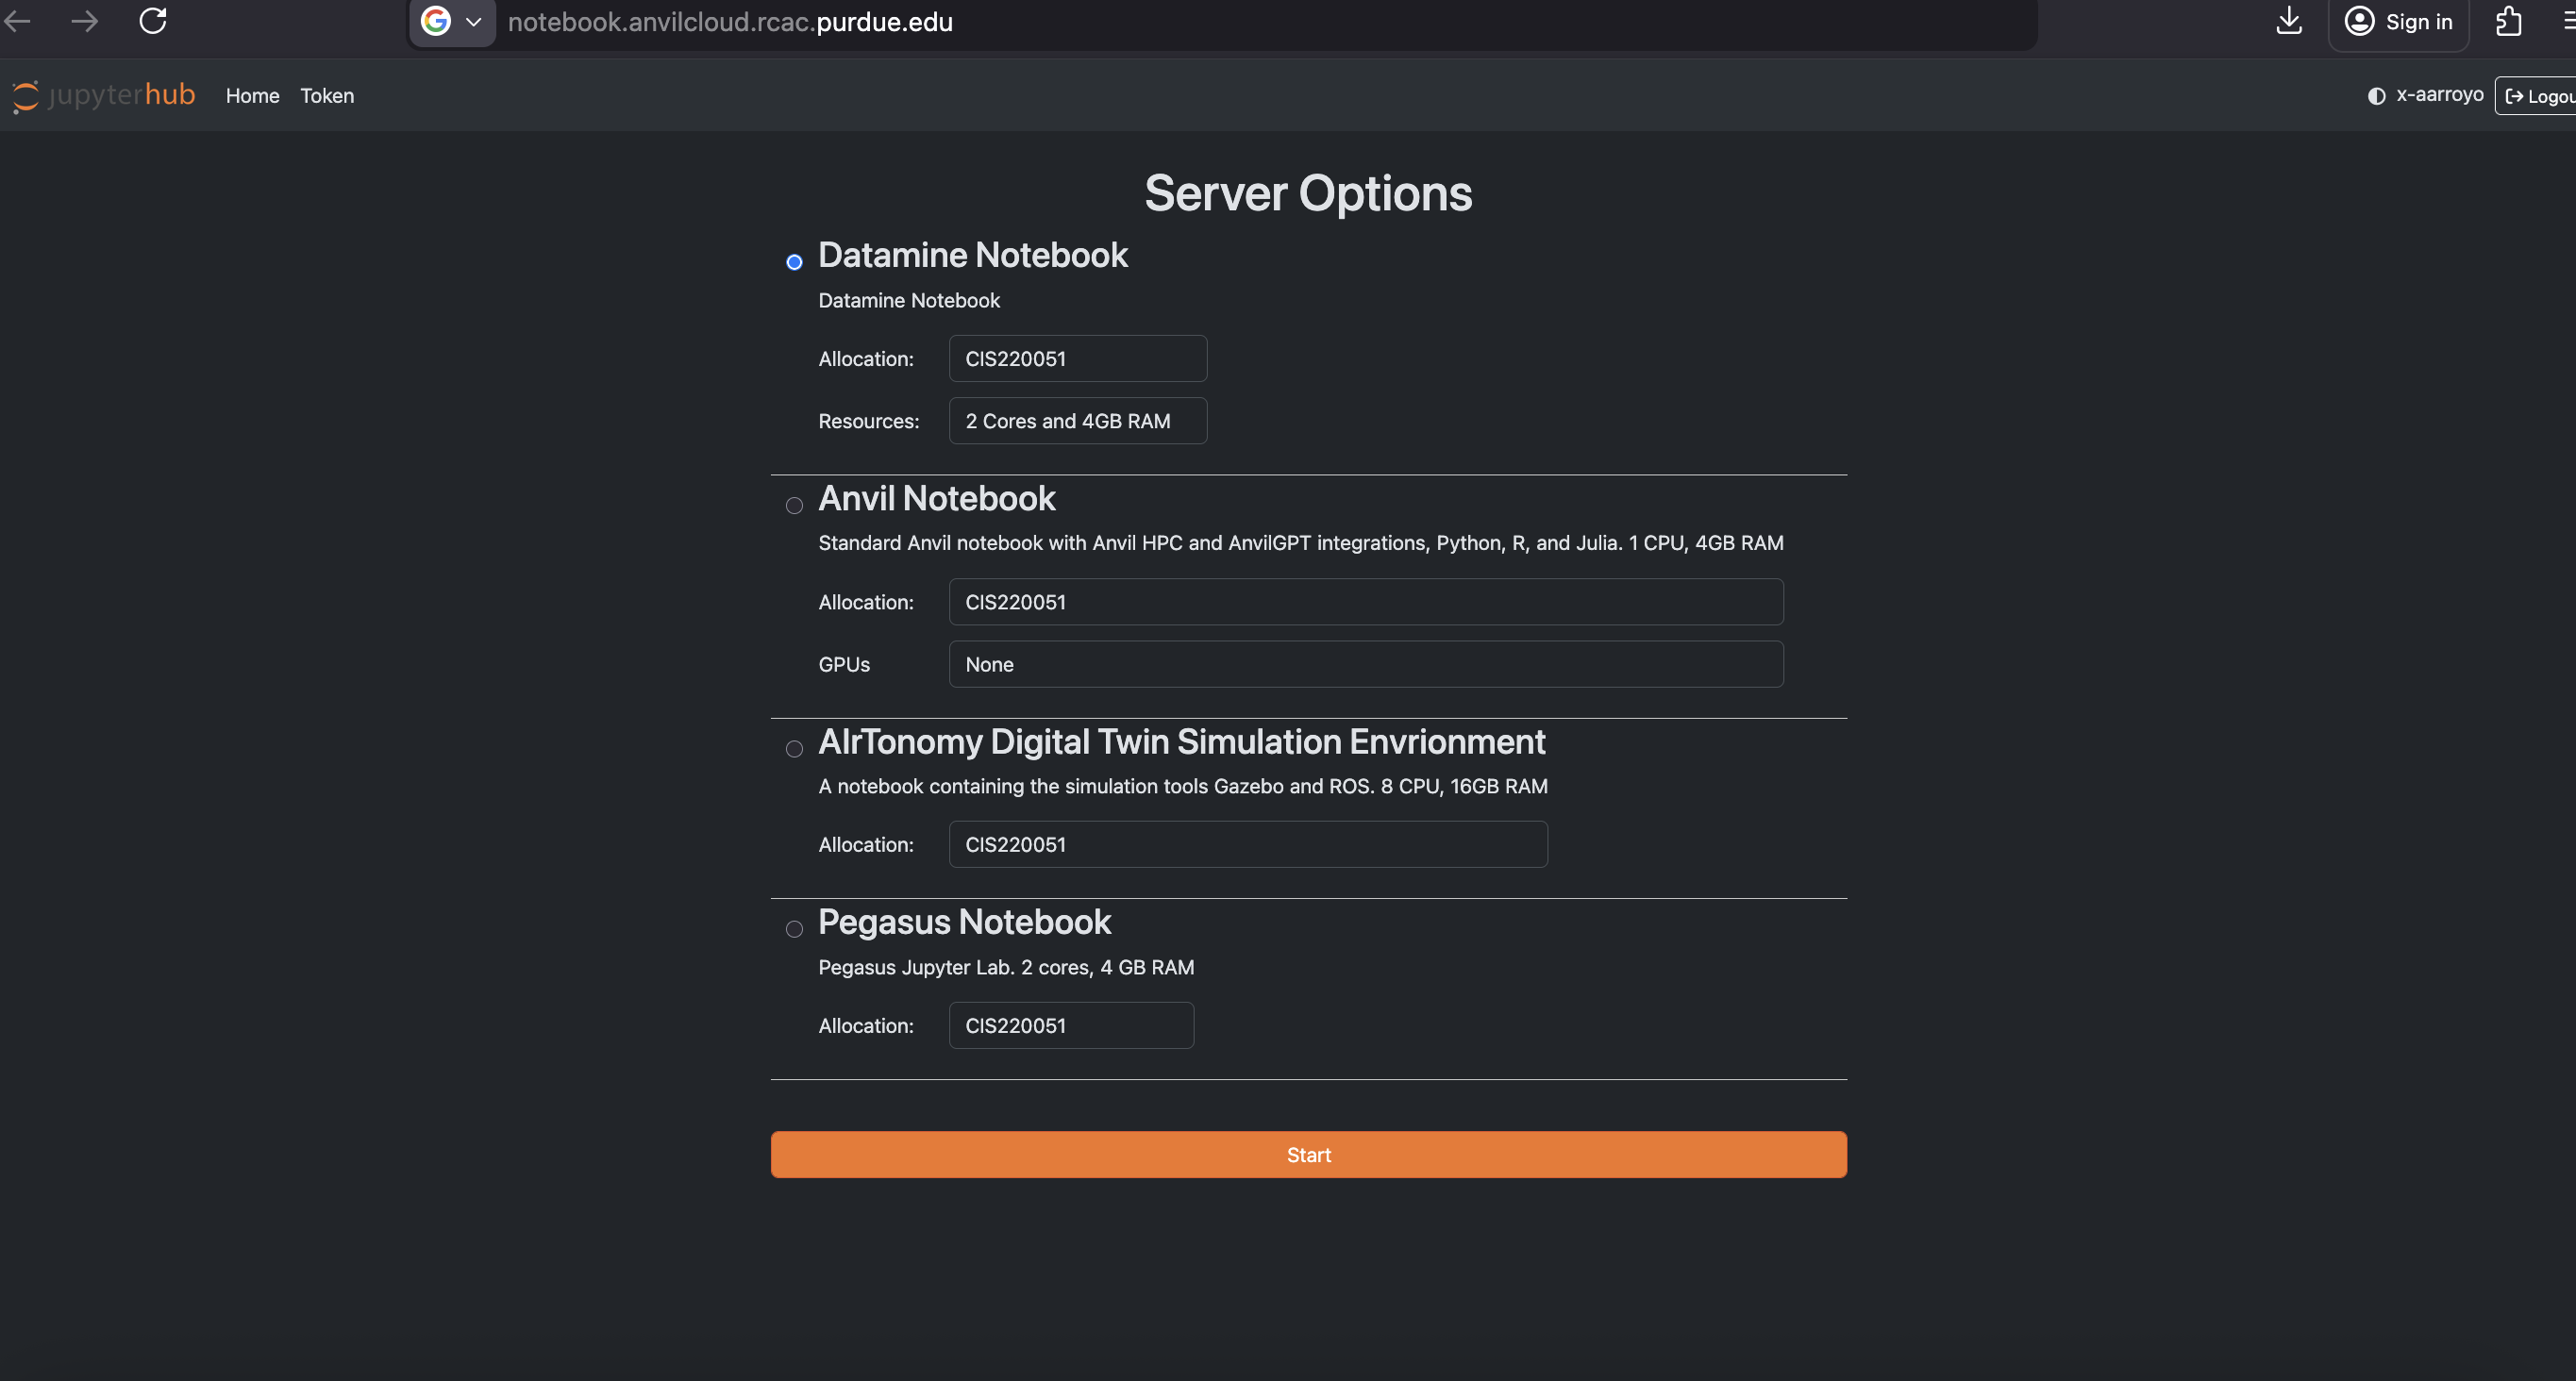
There are a few key parts of this screen to note:
-
You need to use Datamine Notebook (not the Anvil Notebook) for The Data Mine
-
Resources: CPU cores do the computation for the programs we run. It may be tempting to request a large number of CPU cores and RAM, and set it to the maximum, but our computing cluster is a shared resource. This means every computational core that you use is one that someone else can’t use. We only have a limited number of cores assigned to our team, so please ONLY reserve 2 Cores and 4GB RAM, unless the project needs more cores.
|
The Jupyter Lab environment will save your work at regular intervals, so that at the end of a session, your work should be automatically saved. Nonetheless, you can select File from the menu and Save Notebook any time that you want. (It is not necessarily, because Jupyter Lab saves automatically, but you can still save anytime if you want to.) |
With the key parts of this screen explained, go ahead and start Datamine Notebook and click the orange Start button! After a bit of waiting, you should see something like below while you are waiting for just a few seconds (sometimes it is fast and you will not even see this!)
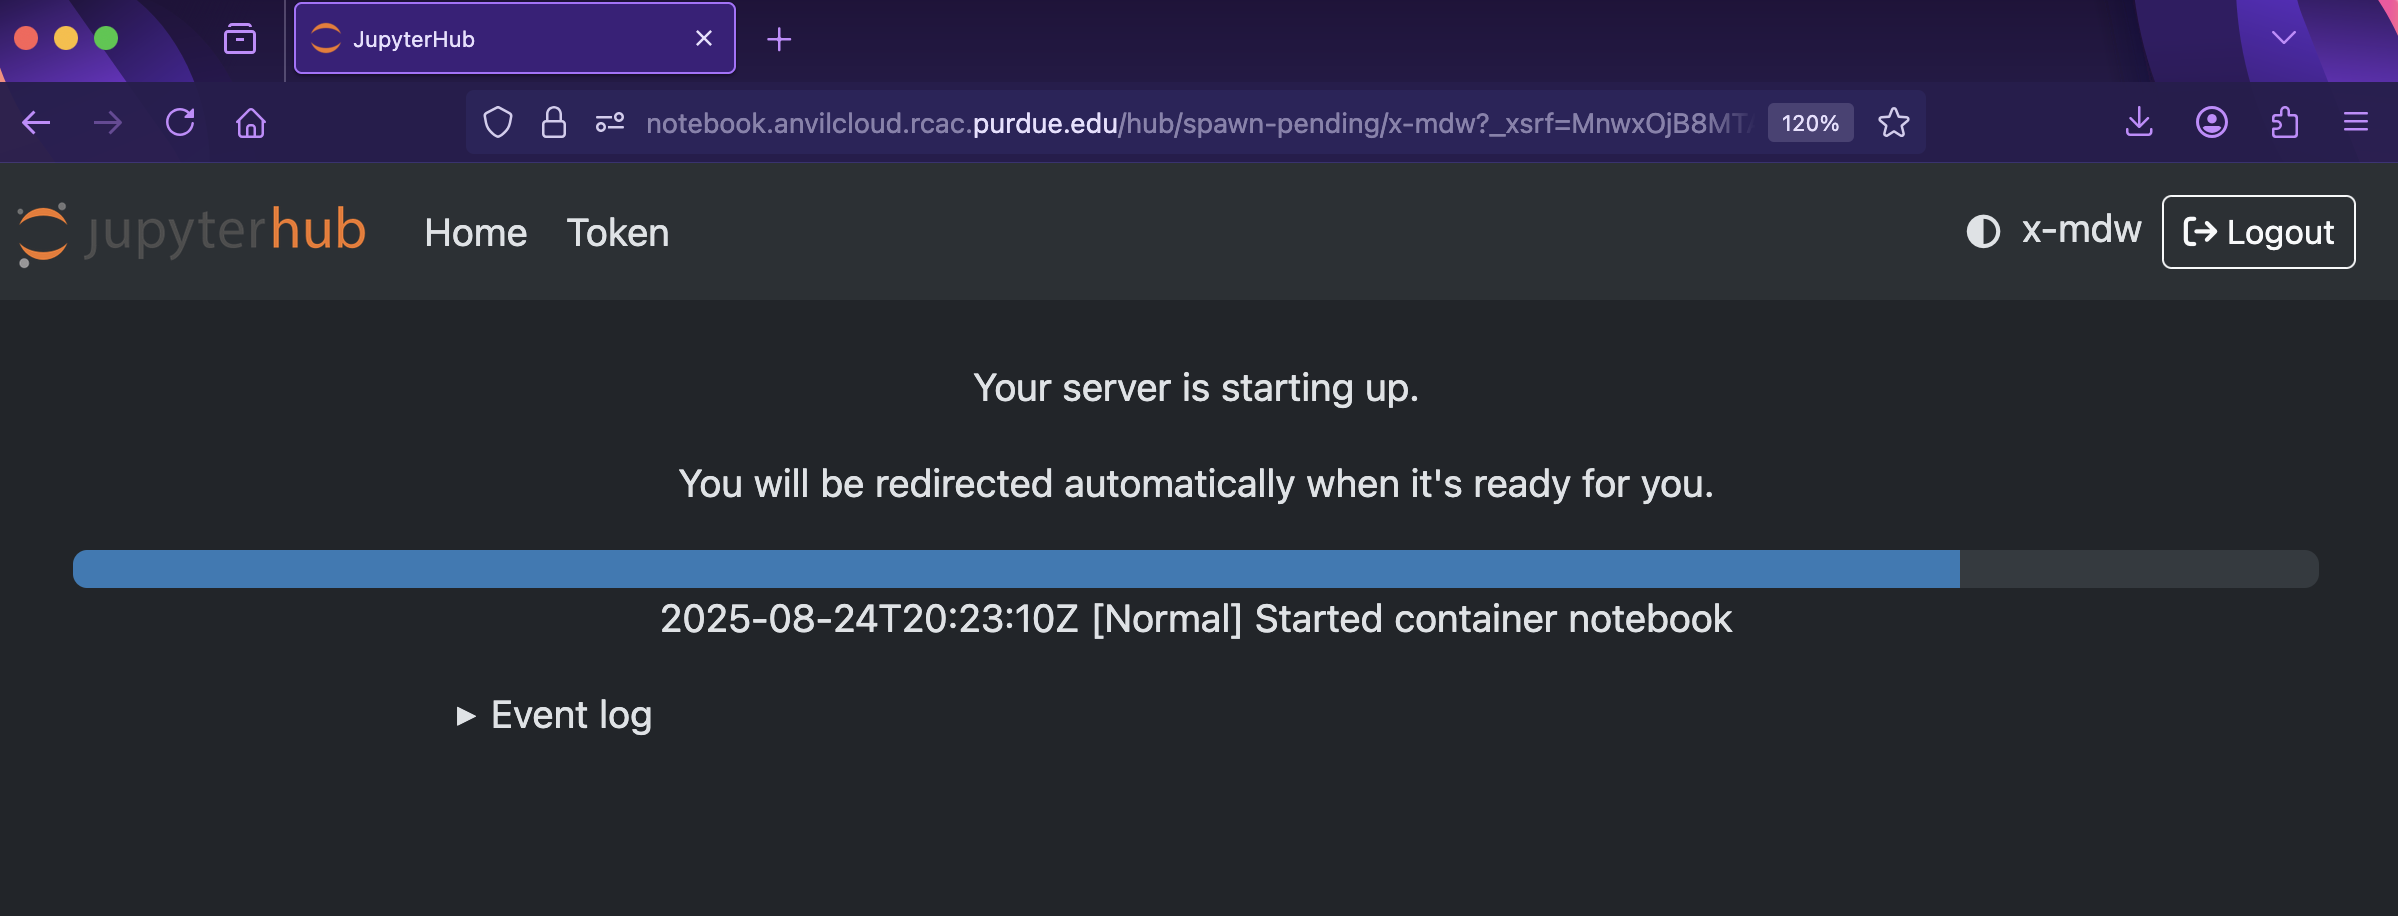
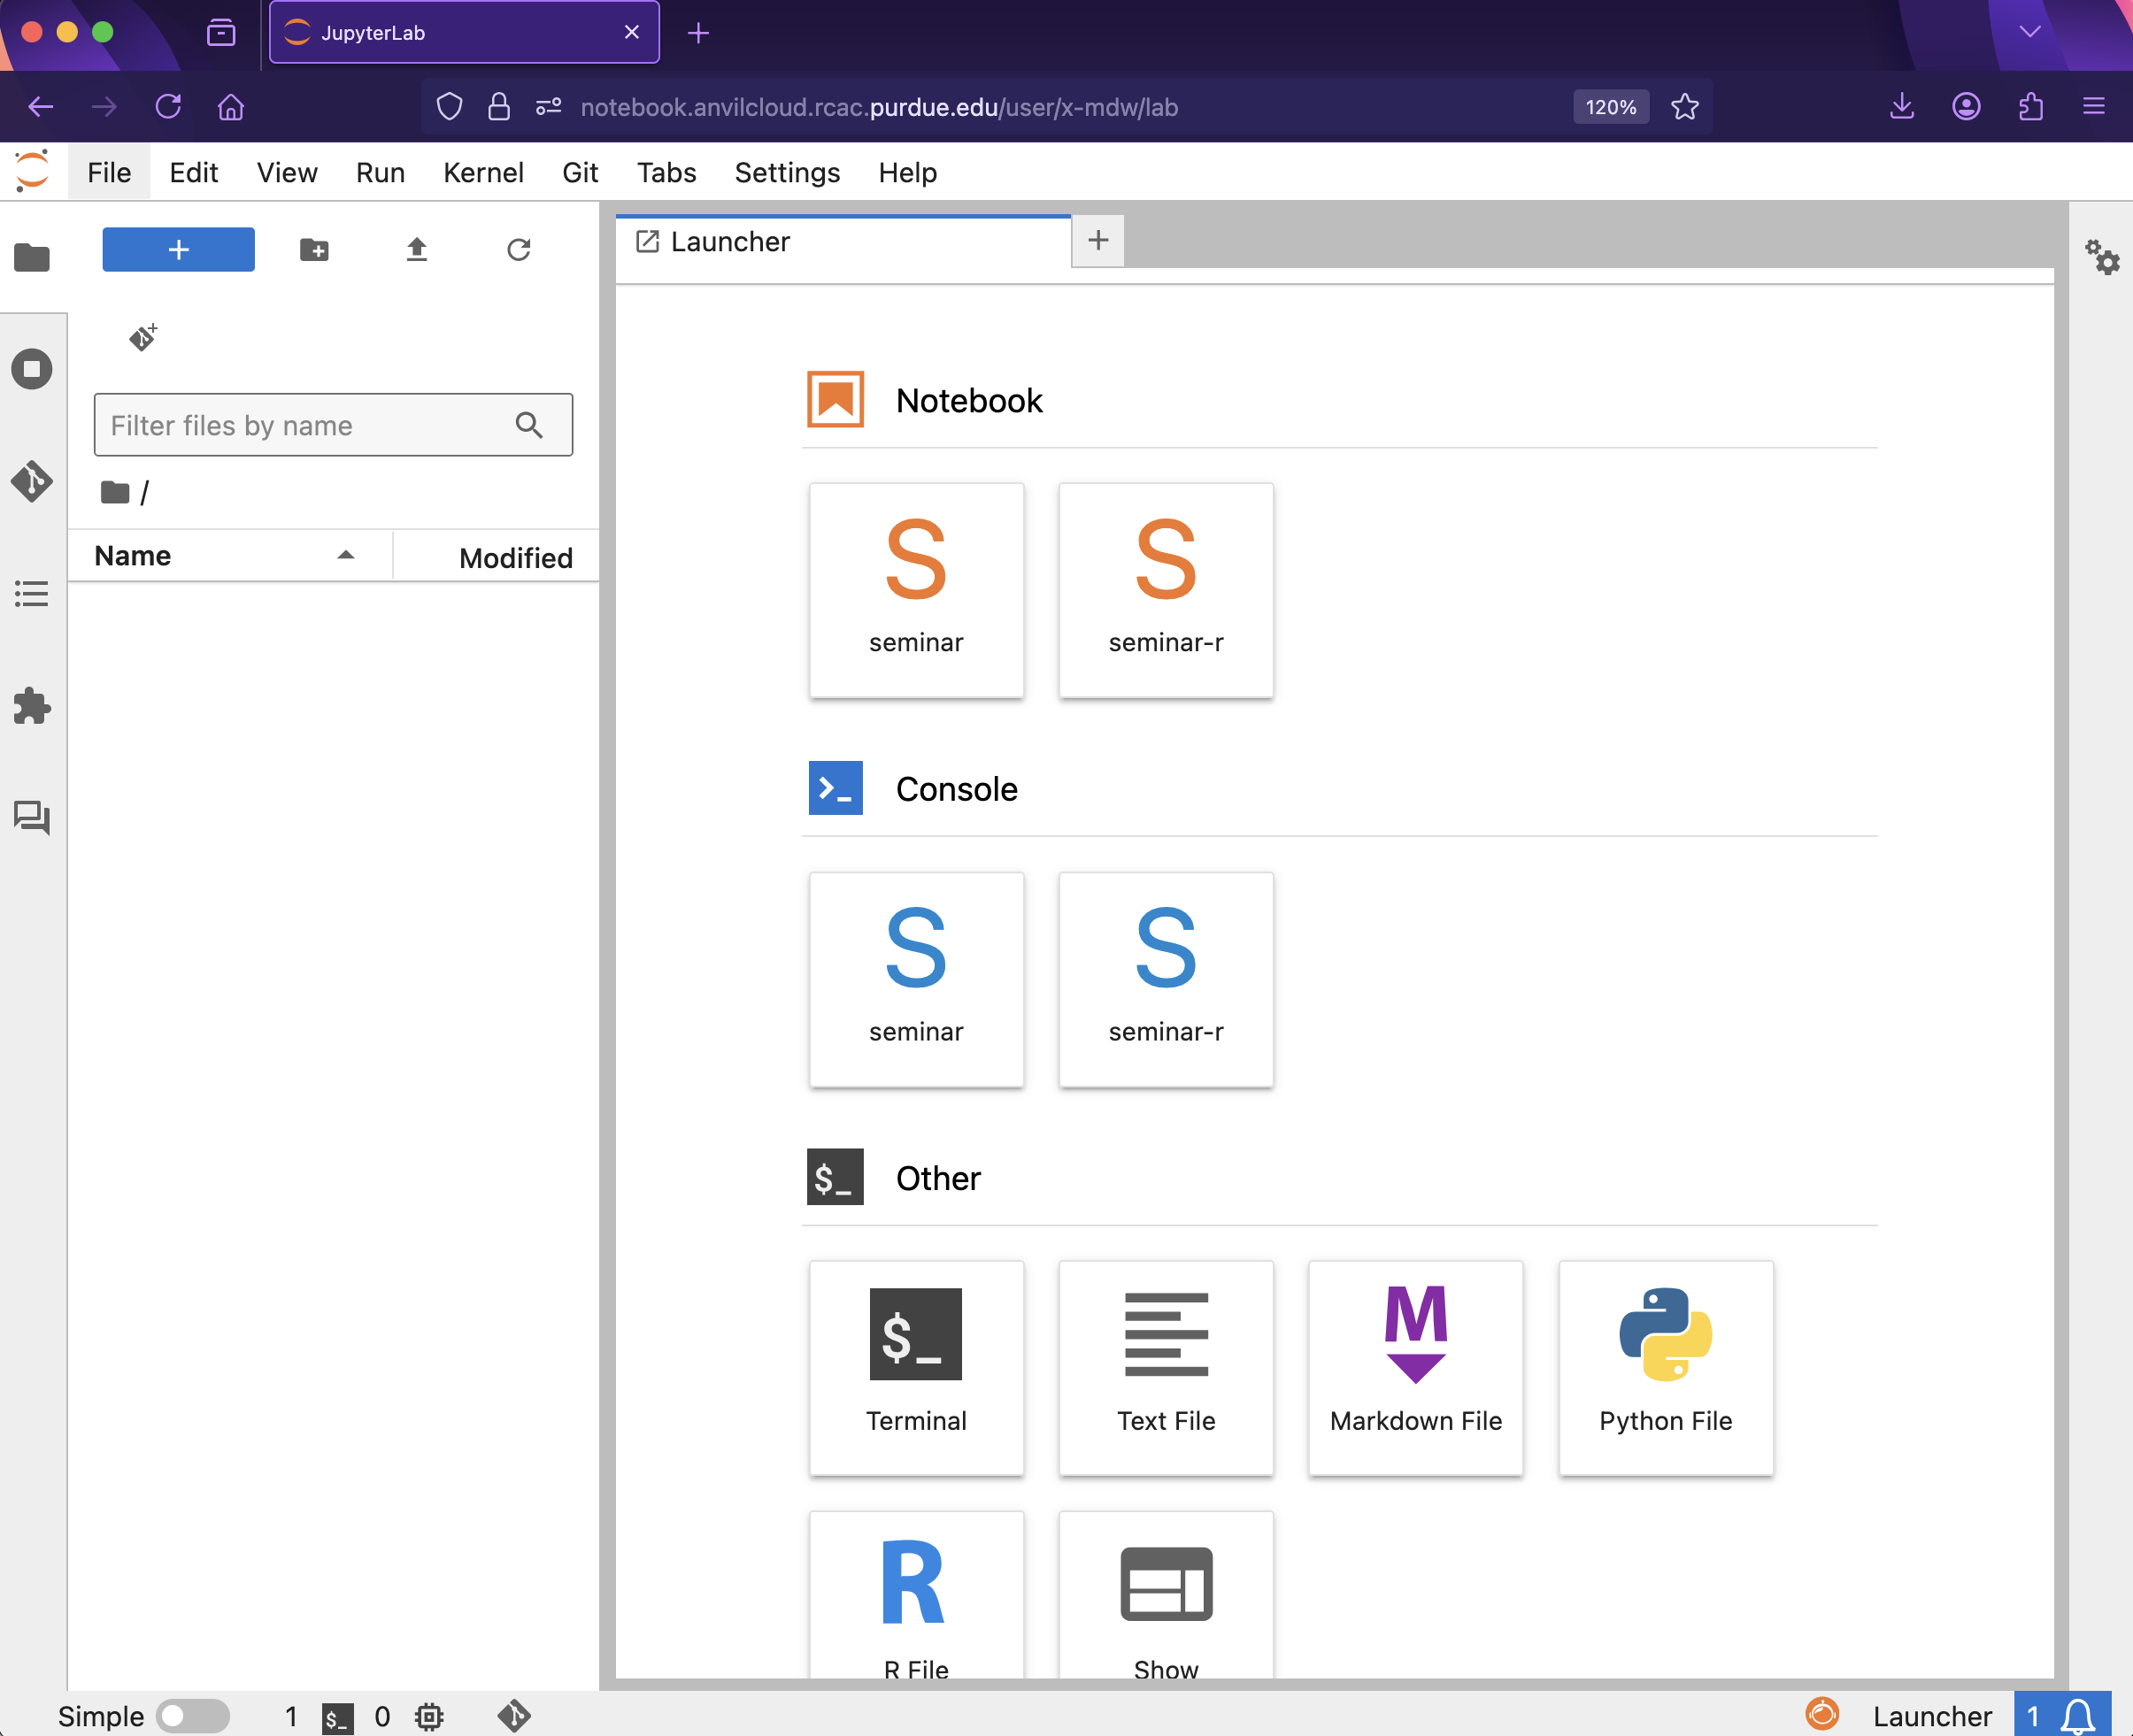
and then, when the Jupyter Lab is ready for you to work, you will see this:
|
You likely noticed a short wait before your Jupyter session launched. This happens while Anvil finds and allocates space for you to work. The more students are working on Anvil, the longer this will take, so it is our suggesting to start your projects early during the week to avoid any last-minute hiccups causing a missed deadline. Please do not wait until Wednesdays to complete and submit your work! |
|
The projects are usually due on Wednesdays. You can see the schedule here: the-examples-book.com/projects/spring2026/10200/projects Please do not wait until Wednesday to complete and submit your work! |
Download the project template, as described here: https://the-examples-book.com/projects/templates
When you first open the template, you may get a pop-up asking you to select what kernel you’ll be using. Select the seminar kernel (not the seminar-r kernel). If you do not get this pop-up, you can also select a kernel by clicking on the upper right part of your screen that likely says something similar to No Kernel, and then selecting the kernel you want to use.
We give some information about kernels here: the-examples-book.com/projects/kernels
As you continue to get comfortable with Jupyter Lab, you might want to read more about Jupyter Lab (this is optional).
Questions
Question 1 (2 pts)
First, as an example, we can load the head of the airports subset data, as described in the videos. We did this during fall 2025 in R, but this semester (instead) we will work in Python!
We will start by loading the airports data set in Python, and displaying the head of the airports data set.
import pandas as pd
myDF = pd.read_csv("/anvil/projects/tdm/data/flights/subset/airports.csv")
myDF.head()
Just try this Python code using the seminar kernel (not the seminar-r kernel) and make sure that you can see the first five rows of the airports data frame.
OK, now that we know how to load a data set in Python, load the data from the Olympics data set, about the Athlete Events. This data is located in this file:
/anvil/projects/tdm/data/olympics/athlete_events.csv
You can also send a specific argument (like the number 12) to a Python method. The head method has a parameter called n that specifies the number of rows that appear. By default, n has value 5, but you can change this value, e.g., by using head(12) instead of head(). Please give this a try! There are also some examples on the documentation page:
-
(It is optional, if you want to show how you loaded the airport data.)
-
Use Python to show the output with the first five rows (which is the default) of the Olympics Athlete Events data frame.
-
Now use Python to show the first twelve rows of the Olympics Athlete Events data frame.
-
Be sure to document your work from Question 1, using some comments and insights about your work.
Question 2 (2 pts)
In Python, we often use the Pandas library for loading DataFrames. Pandas allows us to check some properties of our data frame. For instance, we can use the shape property to see how many rows and columns the airports DataFrame has:
myDF = pd.read_csv("/anvil/projects/tdm/data/flights/subset/airports.csv")
myDF.shape
Notice that Python starts counting from 0 (as opposed to R, which starts counting from 1). So the initial row of the Pandas DataFrame is row 0. In the head of the DataFrame, as we saw in Question 1, we see rows 0, 1, 2, 3, 4.
If you load the tail of the airports DataFrame (which we used as a demonstration example at the start of Question 1), it displays rows 3371, 3372, 3373, 3374, 3375. As indicated by the shape parameter, the airports DataFrame has 3376 rows altogether, so this makes sense. You can check this as follows:
myDF.tail()We can also select rows of the data frame that meet certain conditions. For instance, we can extract the airports located in New York City as follows:
myDF[(myDF['city'] == 'New York') & (myDF['state'] == 'NY')]Now that you know how to find specific rows in a data frame, please load the Olympics Athlete Events data frame.
Use the data frame to identify the names of the athletes from Jamaica who competed in the Bobsleigh race during the Winter 1988 Olympics.
There is a fictional movie about this event:
and the real story is given here:
For each question in The Data Mine, please always be sure to put some comments after your cells, which describe all of the work that you are doing in the cells, as well as your thinking and insights about the results.
|
Some common Jupyter notebooks shortcuts:
|
-
(It is optional, if you want to show how you experimented with the tail of the airport data and specific rows in the airport data.)
-
Use the
shapeproperty to see how many rows and columns are in the Olympics Athlete Events data frame. -
Display the
tailof the Olympics Athlete Events data. -
Identify the names of the 4 athletes from Jamaica who competed in the Bobsleigh race during the Winter 1988 Olympics. Your result will show 6 rows (and that is OK!) because two of these athletes competed in two versions of the race.
-
Be sure to document your work from Question 2, using some comments and insights about your work.
Question 3 (2 pts)
Now we learn how to identify the values that occur repeatedly, in a column of a data frame. For our example, we will study which state has the largest number of airports. (We will not pay attention to the city, in this example.) How many airports are located in that state? We can figure this out, by writing:
myDF['state']and then the value_counts function gives the number of airports in each state:
myDF['state'].value_counts()Finally, we can make a plot of the value counts for the airports example!
Now that you are familiar with analyzing a column in a data set, use the Team Column from the Olympics Athlete Events data frame, to find the 5 countries that have the most athletes (altogether). Then make a plot that displays the total number of rows for each of these top 5 countries.
-
(It is optional, if you want to show how you displayed the top five states in the airports data set.)
-
Use the
TeamColumn from the Olympics Athlete Events data frame, to find the 5 countries that have the most athletes (altogether). -
Make a plot that displays the total number of rows for each of these top 5 countries.
-
Be sure to document your work from Question 3, using some comments and insights about your work.
Question 4 (2 pts)
Now we can practice our skills that we learned in the questions above.
Consider the data set about restaurant vendors stored here:
/anvil/projects/tdm/data/restaurant/vendors.csv
In the column vendor_category_en we can see information about the two types of vendors. Display both types of vendors, and the number of times that each vendor appears.
-
Display both types of vendors, and the number of times that each vendor appears.
-
Be sure to document your work from Question 4, using some comments and insights about your work.
Question 5 (2 pts)
Now make a (very!) simple barplot that displays both types of vendors, and the number of times that each vendor appears. Your barplot will have only two columns, showing the two types of vendors, and the number of times that each one occurs.
-
Make a (very!) simple barplot that displays both types of vendors, and the number of times that each vendor appears.
-
Be sure to document your work from Question 5, using some comments and insights about your work.
Submitting your Work
Please make sure that you added comments for each question, which explain your thinking about your method of solving each question. Please also make sure that your work is your own work, and that any outside sources (people, internet pages, generative AI, etc.) are cited properly in the project template.
Congratulations! Assuming you’ve completed all the above questions, you’ve just finished your first project for TDM 10200! If you have any questions or issues regarding this project, please feel free to ask in seminar, over Piazza, or during office hours.
Prior to submitting your work, you need to put your work into the project template, and re-run all of the code in Jupyter Lab and make sure that the results of running that code is visible in your template. Please check the detailed instructions on how to ensure that your submission is formatted correctly. To download your completed project, you can right-click on the file in the file explorer and click 'download'.
Once you upload your submission to Gradescope, make sure that everything appears as you would expect to ensure that you don’t lose any points. We hope your first project with us went well, and we look forward to continuing to learn with you on future projects!!
-
firstname_lastname_project1.ipynb
|
It is necessary to document your work, with comments about each solution. All of your work needs to be your own work, with citations to any source that you used. Please make sure that your work is your own work, and that any outside sources (people, internet pages, generative AI, etc.) are cited properly in the project template. You must double check your Please take the time to double check your work. See submission page for instructions on how to double check this. You will not receive full credit if your |