TDM 10100: R Project 1 — Fall 2025
Motivation: Our goal in Project 1 is to help you get comfortable with aspects of The Data Mine. We use Jupyter Lab on the Anvil computational cluster. In this first project, it is OK to ask many questions and to explore! (It is always OK to ask questions.) The main goal is to get prepared to work in The Data Mine. We are happy to have you join this experience.
Context: In The Data Mine, we do not require any background or prerequisites. It is OK if this is your first time working with data. No background is needed. We aim to give practical examples and to always be "learning by doing."
Scope: Anvil, Jupyter Lab, R
Dataset(s)
This project will use the following dataset(s):
-
/anvil/projects/tdm/data/flights/subset/airports.csv -
/anvil/projects/tdm/data/olympics/athlete_events.csv
First and foremost, welcome to The Data Mine! We hope that throughout your journey with us, you learn a lot, make new friends, and develop skills that will help you with your future career. Throughout your time with The Data Mine, you will have plenty of resources available should you need help. By coming to weekly seminar, posting on the class Piazza page, and joining Dr. Ward and the TA team’s office hours, you can ensure that you always have the support you need to succeed in this course.
The links to Piazza are:
Dr Ward is also available on Monday mornings in the Hillenbrand dining court from 8:30 AM to 11:20 AM (Eastern time zone). He is also available on Monday afternoons during 4:30 PM to 5:20 PM on Zoom at https://purdue-edu.zoom.us/my/mdward/
|
If you did not (yet) set up your 2-factor authentication credentials with Duo, you can set up the credentials here: https://the-examples-book.com/setup If you are still having issues with your ACCESS ID, please send an email containing as much information as possible about your issue to [email protected] |
Let’s start off by starting up our first Jupyter session on Anvil! We always use the URL https://notebook.anvilcloud.rcac.purdue.edu and the ACCESS username that you were assigned (when you setup your account) and the ACCESS password that you chose. These are NOT the same as your Purdue account! (If you are talking to someone who was in The Data Mine last year, this URL is also new for fall 2025!)
|
These credentials are not the same as your Purdue account. |
You should now be on a screen that looks like this:
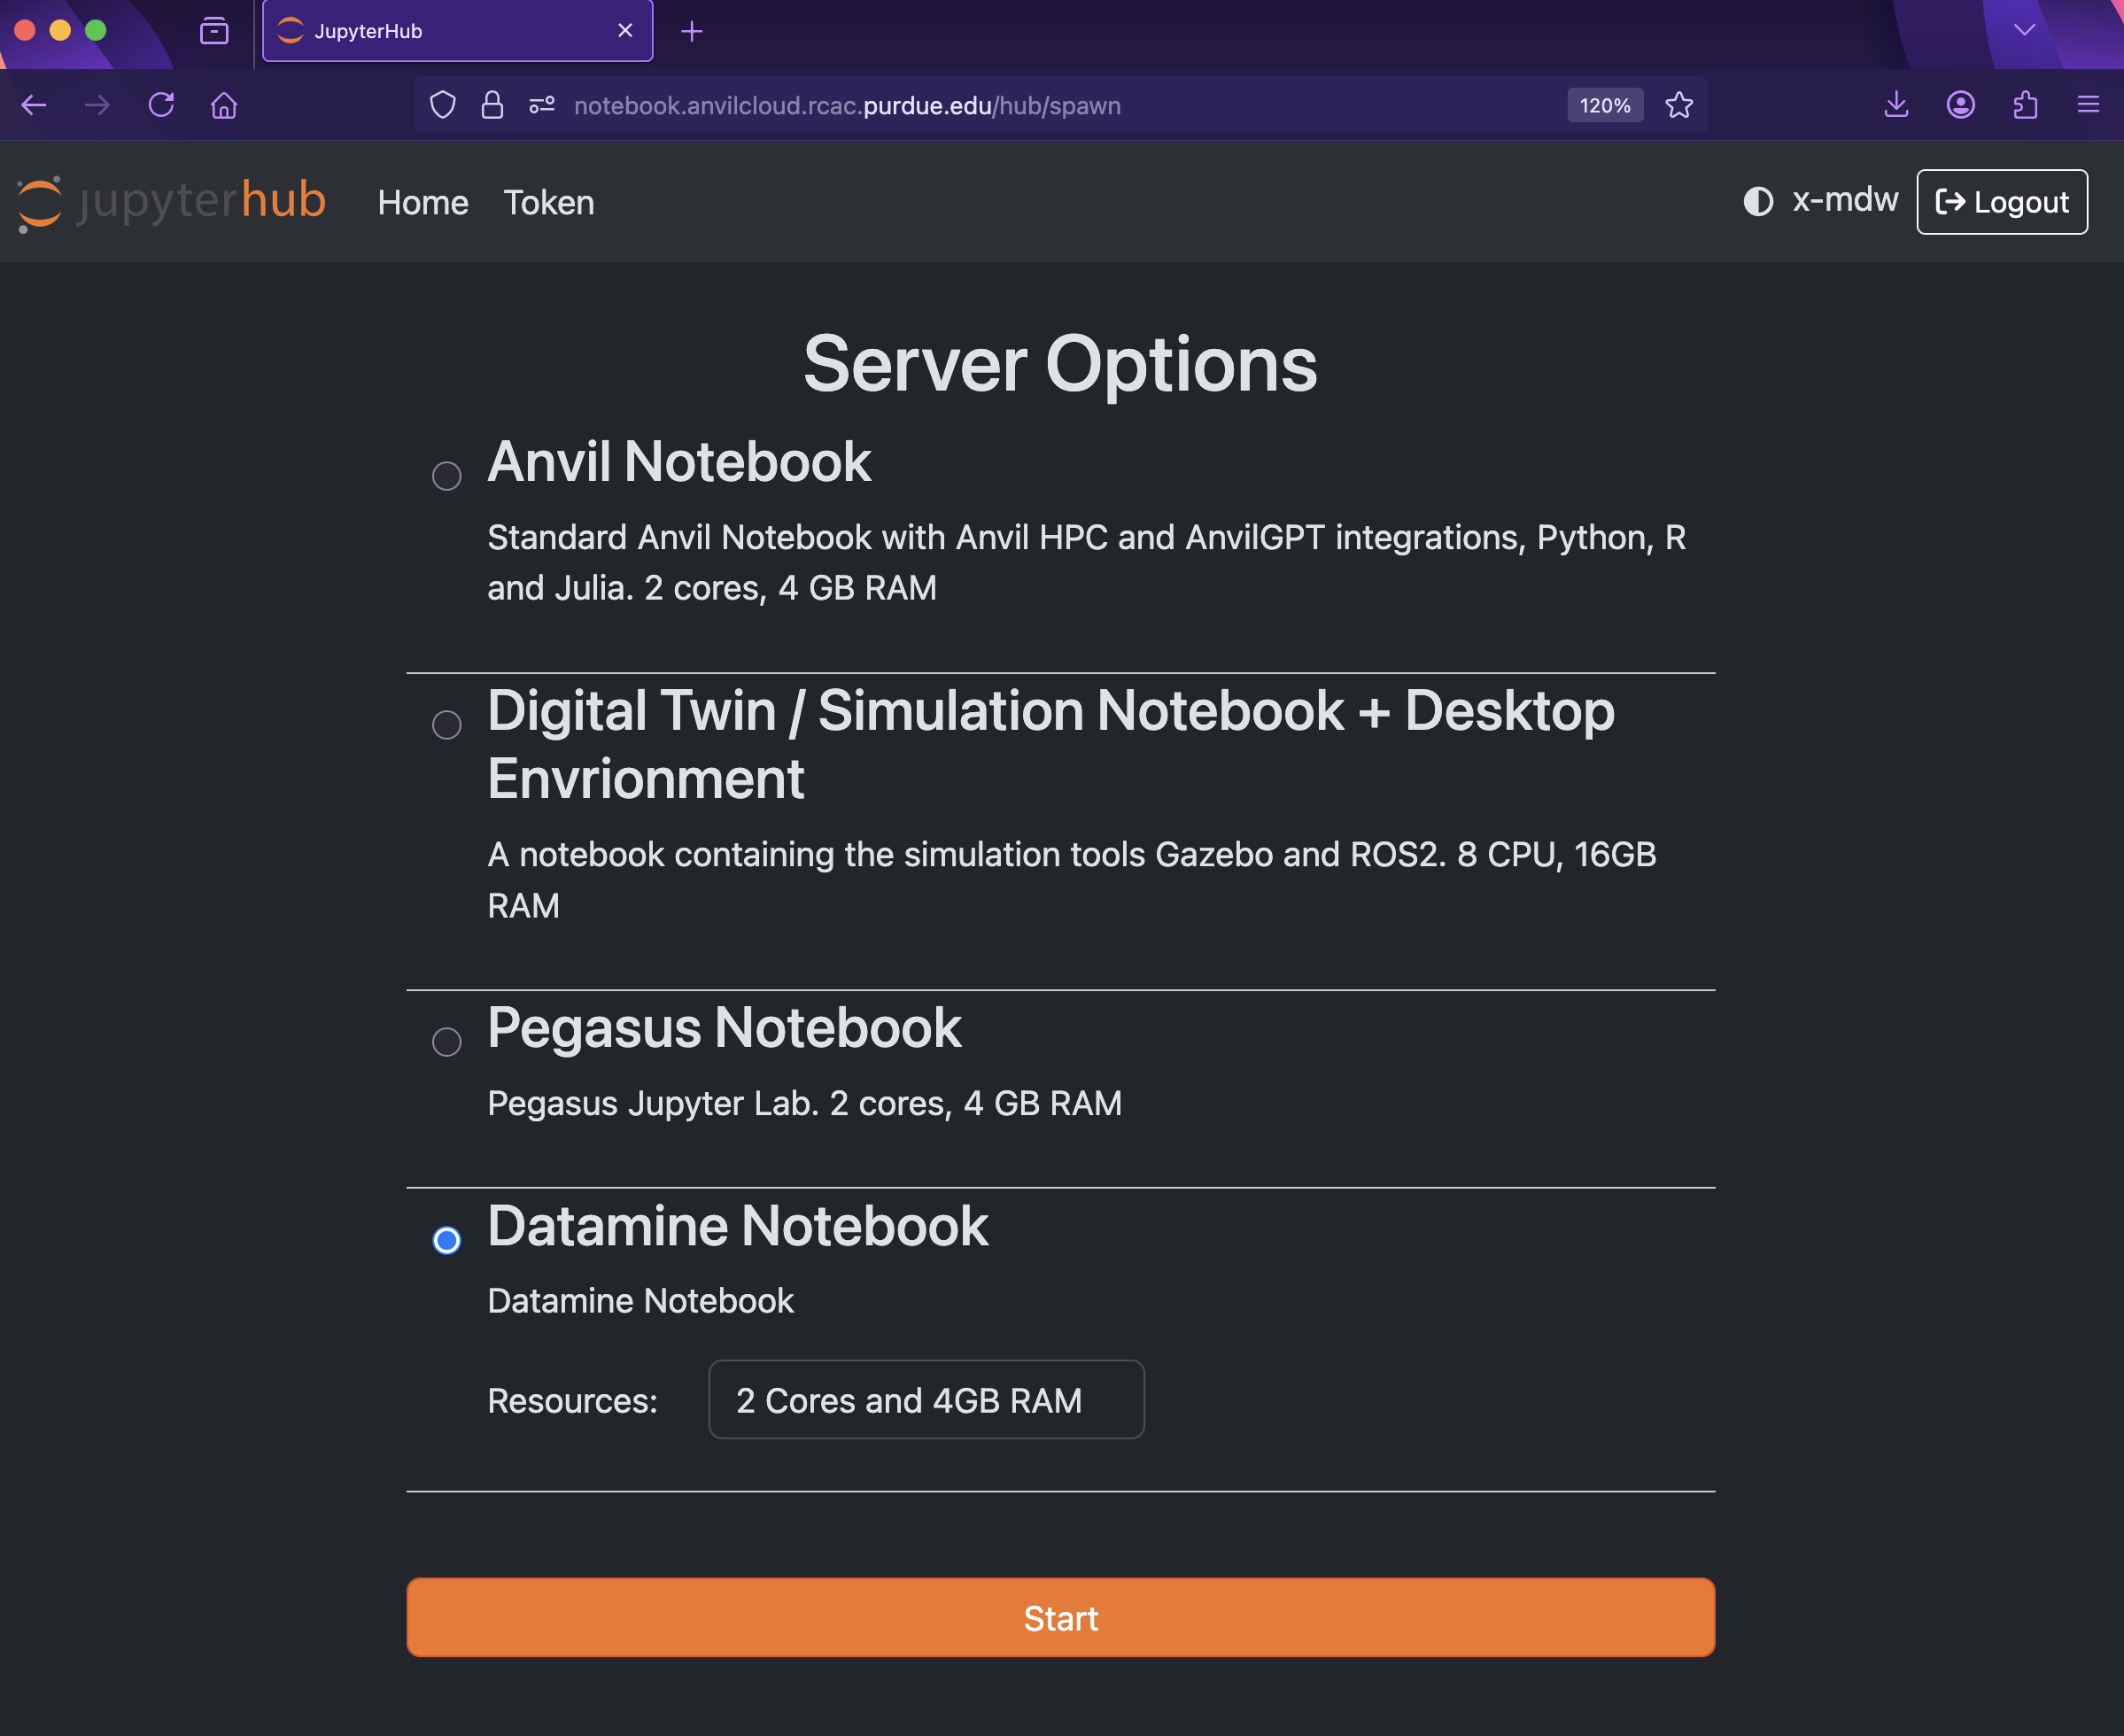
There are a few key parts of this screen to note:
-
You need to use Datamine Notebook (not the Anvil Notebook) for The Data Mine
-
Resources: CPU cores do the computation for the programs we run. It may be tempting to request a large number of CPU cores and RAM, and set it to the maximum, but our computing cluster is a shared resource. This means every computational core that you use is one that someone else can’t use. We only have a limited number of cores assigned to our team, so please ONLY reserve 2 Cores and 4GB RAM, unless the project needs more cores.
|
The Jupyter Lab environment will save your work at regular intervals, so that at the end of a session, your work should be automatically saved. Nonetheless, you can select File from the menu and Save Notebook any time that you want. (It is not necessarily, because Jupyter Lab saves automatically, but you can still save anytime if you want to.) |
With the key parts of this screen explained, go ahead and start Datamine Notebook and click the orange Start button! After a bit of waiting, you should see something like below while you are waiting for just a few seconds (sometimes it is fast and you will not even see this!)
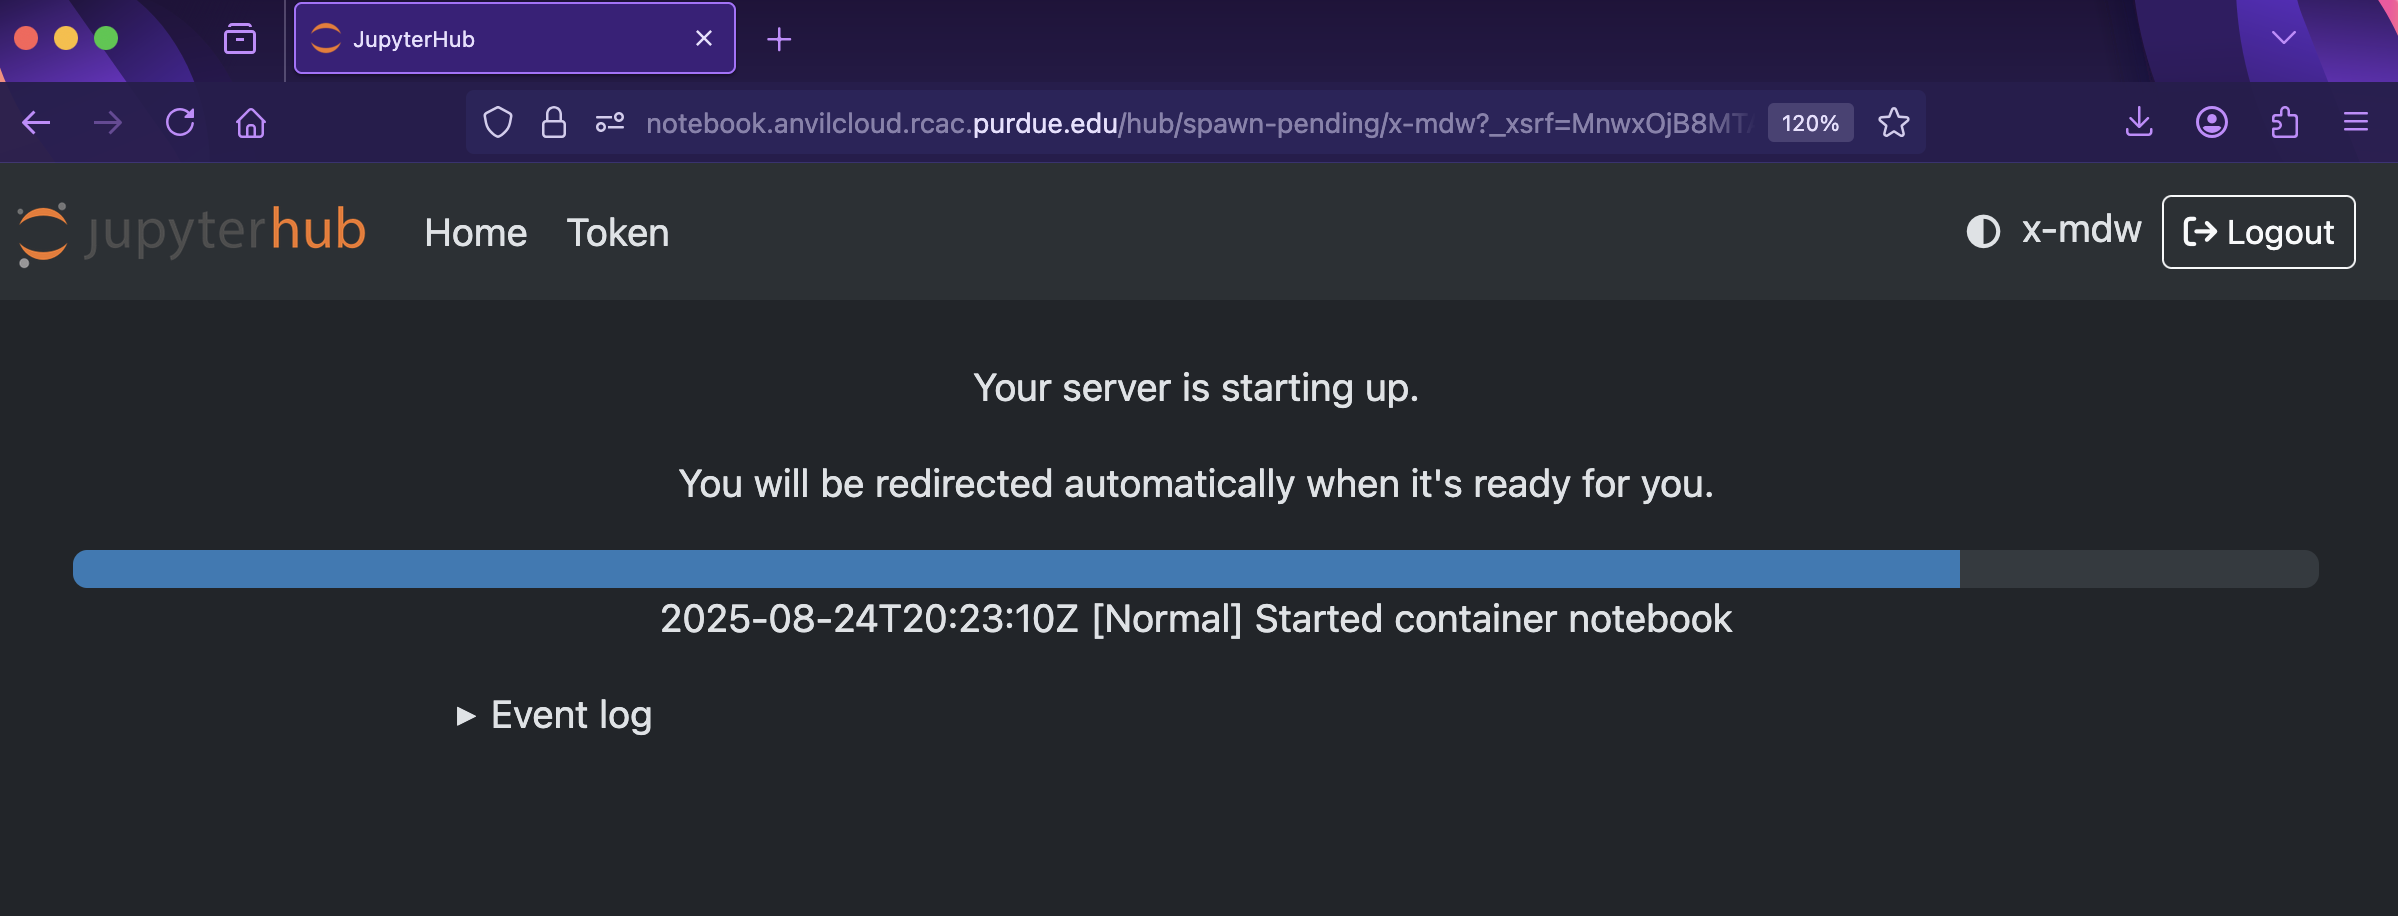
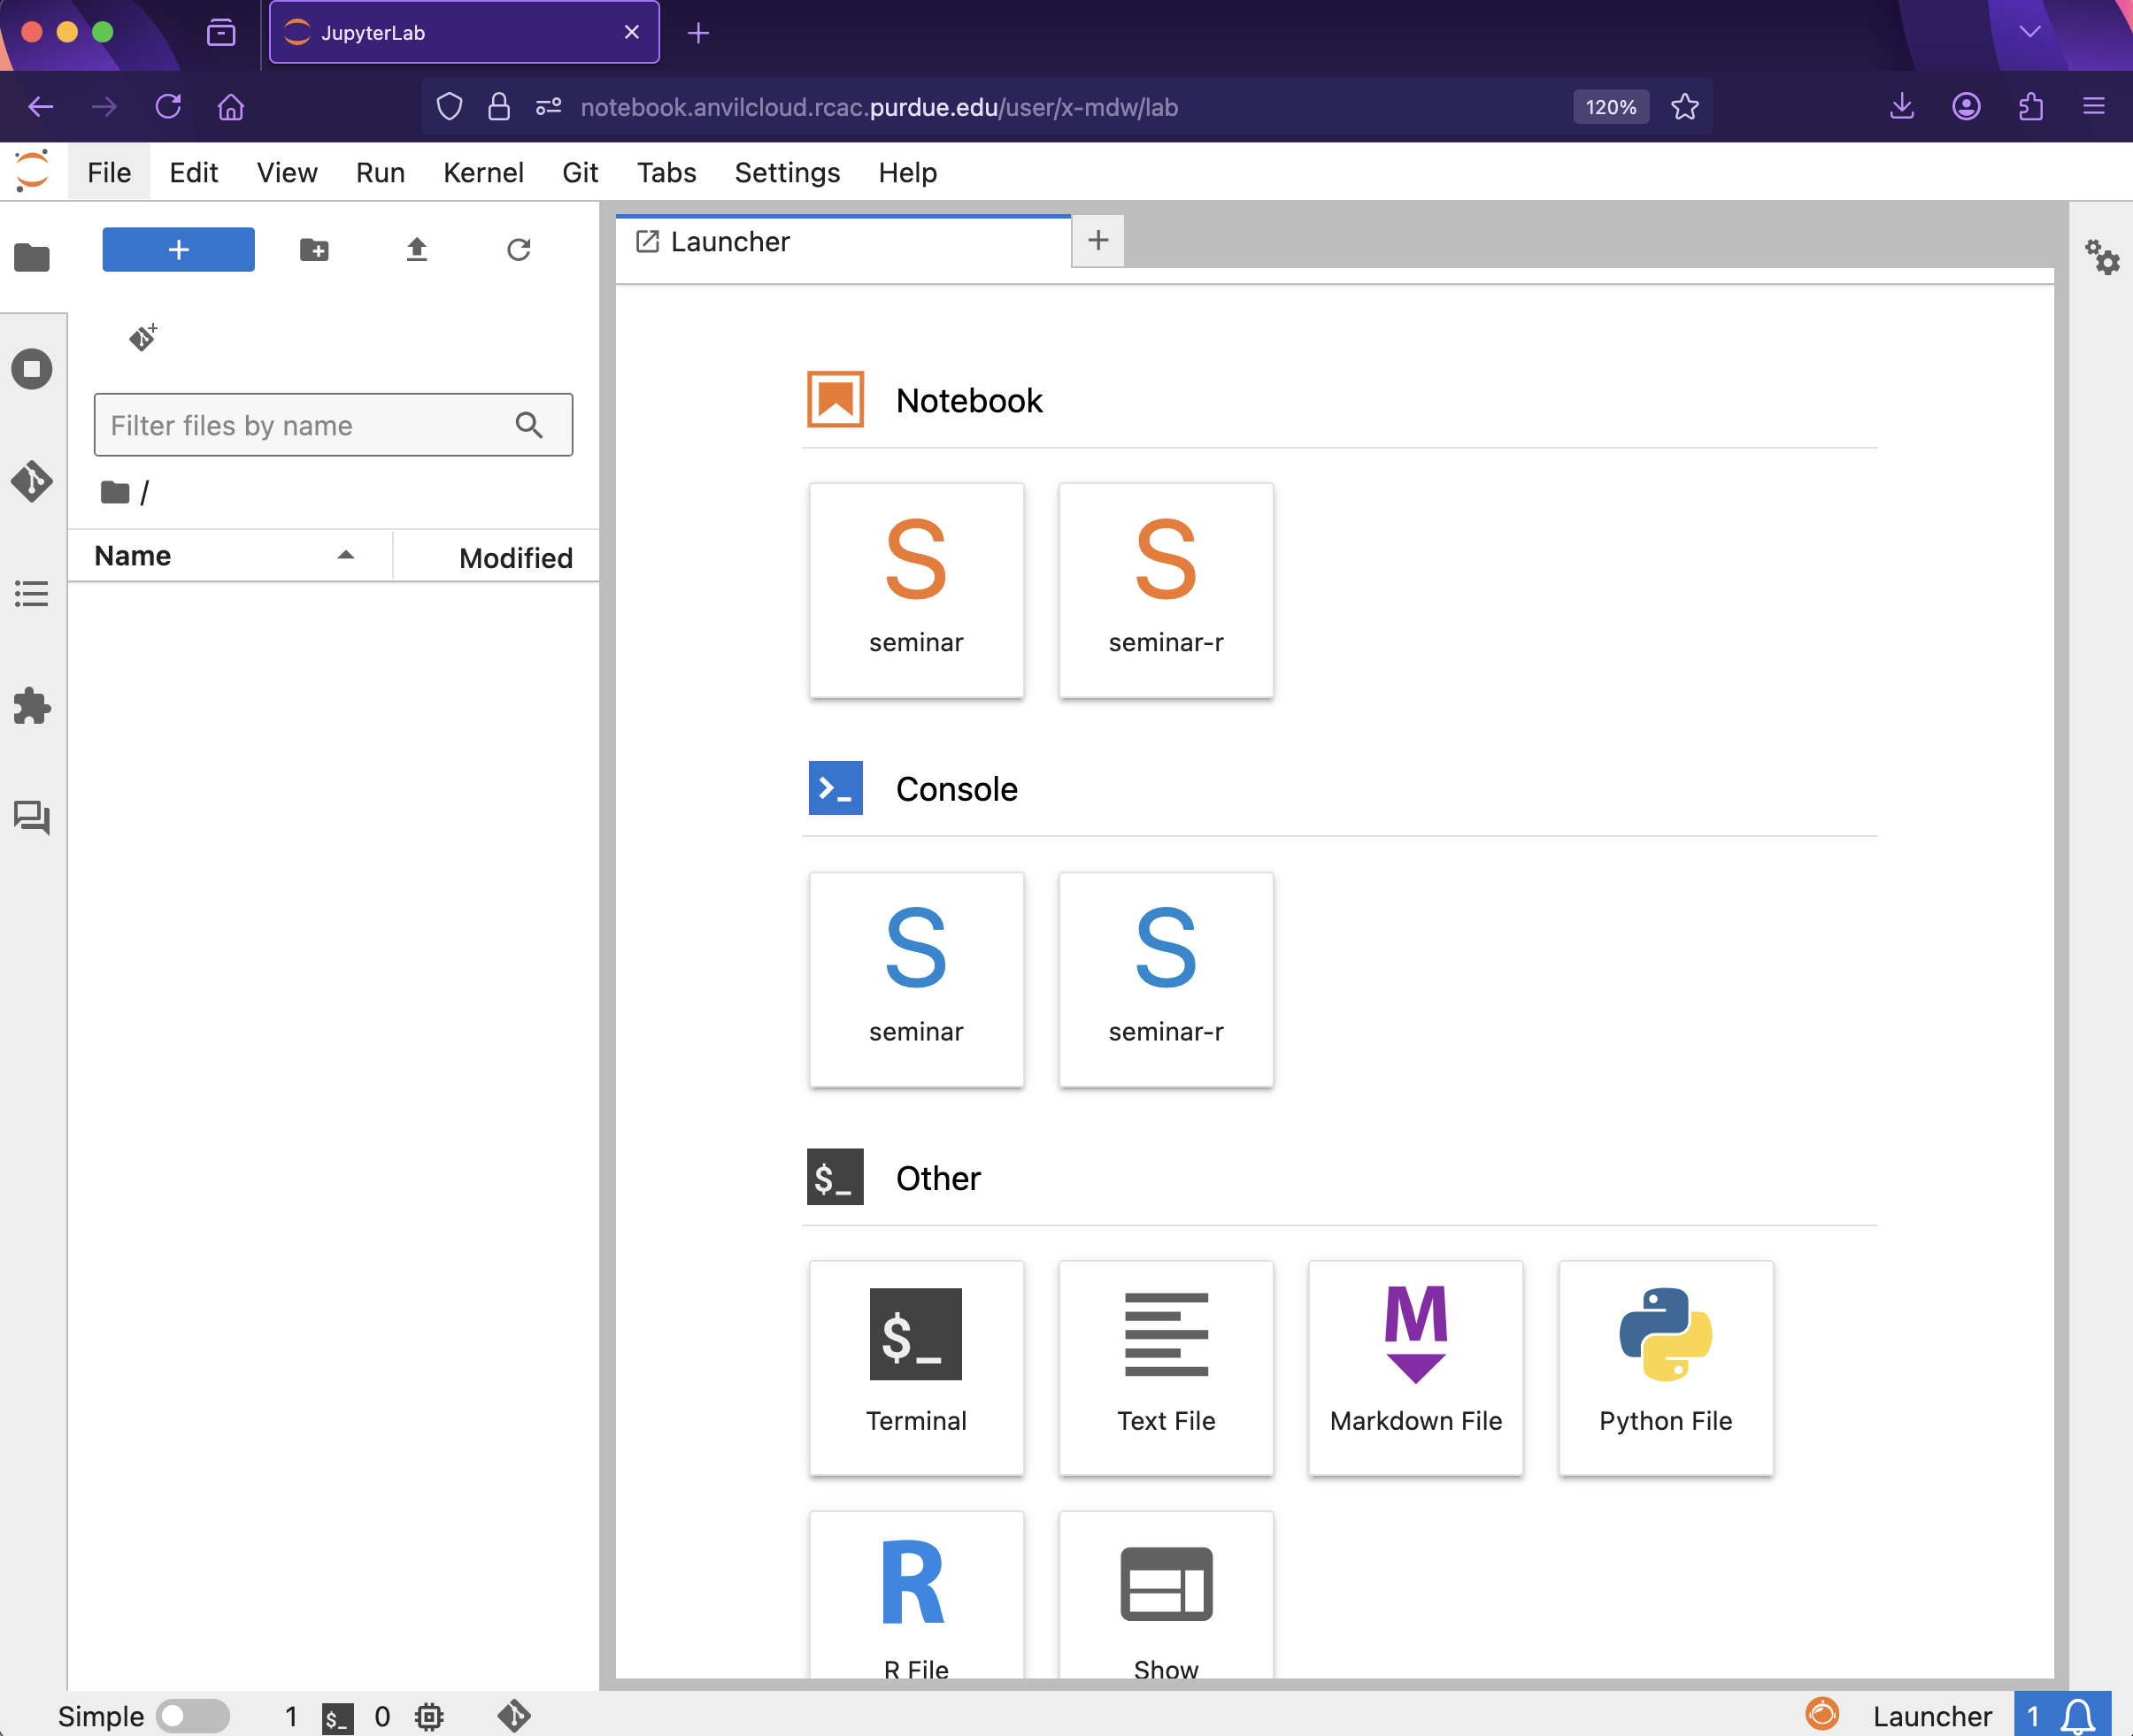
and then, when the Jupyter Lab is ready for you to work, you will see this:
|
You likely noticed a short wait before your Jupyter session launched. This happens while Anvil finds and allocates space for you to work. The more students are working on Anvil, the longer this will take, so it is our suggesting to start your projects early during the week to avoid any last-minute hiccups causing a missed deadline. Please do not wait until Wednesdays to complete and submit your work! |
|
The projects are usually due on Wednesdays. You can see the schedule here: the-examples-book.com/projects/fall2025/10100/projects Please do not wait until Wednesday to complete and submit your work! |
Download the project template, as described here: https://the-examples-book.com/projects/templates
When you first open the template, you may get a pop-up asking you to select what kernel you’ll be using. Select the seminar kernel (not the seminar-r kernel). If you do not get this pop-up, you can also select a kernel by clicking on the upper right part of your screen that likely says something similar to No Kernel, and then selecting the kernel you want to use.
We give some information about kernels here: the-examples-book.com/projects/kernels
As you continue to get comfortable with Jupyter Lab, you might want to read more about Jupyter Lab (this is optional).
Questions
Question 1 (2 pts)
For the first question in this project, let’s try the first R example from the kernel page: the-examples-book.com/projects/kernels
We will load the airports data set in R, using the seminar kernel, and will display the head of the airports data set. The head is the first six lines of the data, and the names of the columns appear above the head.
%%R
myDF <- read.csv("/anvil/projects/tdm/data/flights/subset/airports.csv")
head(myDF)
Just try this R code using the seminar kernel (not the seminar-r kernel) and make sure that you can see the first six rows of the airports data frame.
-
Use R to show the first six rows of the airports data frame.
-
Then use R again to show the first twelve rows of the airports data frame, using the
n=12argument. -
Be sure to document your work from Question 1, using some comments and insights about your work.
Question 2 (2 pts)
Now do this again, using the seminar-r kernel with R, and notice that you do NOT need the %%R cell magic with the seminar-r kernel. You can do all of this in the same Jupyter Lab notebook, just by changing the kernel.
myDF <- read.csv("/anvil/projects/tdm/data/flights/subset/airports.csv")
head(myDF)
You have now loaded the first six lines of the airports data frame in three ways (once in Question 1, and now a second and a third time in Question 2).
A Jupyter notebook is made up of cells, which you can edit and then run. There are two types of cells we’ll work in for this class:
-
Markdown cells. These are where your writing, titles, sections, and paragraphs will go. Double clicking a markdown cell puts it in
editmode, and then clicking the play button near the top of the screen runs the cell, which puts it in its formatted form. More on this in a second. For now, just recognize that most markdown looks like regular text with extra characters like#,*, and-to specify bolding, indentation font, size, and more! -
Code cells. These are where you will write and run all your code! Clicking the play button will run the code in that cell, and the programming language is specified by the language or languages known by the kernel that you chose.
For each question in The Data Mine, please always be sure to put some comments after your cells, which describe all of the work that you are doing in the cells, as well as your thinking and insights about the results.
|
Some common Jupyter notebooks shortcuts:
|
-
Use R to (again) show the output with the first twelve rows of the airports data frame, this time using the
seminar-rkernel instead of theseminarkernel. -
Now use R to show the first ten rows of airports that are located in Indiana.
-
How many airports are located in Indiana altogether? (Use the
dimfunction, as shown in the video.) -
Be sure to document your work from Question 2, using some comments and insights about your work.
Question 3 (2 pts)
In the year 2007, count the number of flights that originate from each airport. Which 20 airports are the most popular in this regard, i.e., in terms of having the most flights originating from those airports?
First, you need to load the data.table library, and then (afterwards), you can load the data for the 2007 flights, as follows:
library(data.table)
myDF <- fread("/anvil/projects/tdm/data/flights/subset/2007.csv")
(We needed the data.table library because it defines the fread function which is much faster and more efficient than the read.csv function from the previous question. After all, we are working with more than 7 million rows of data in this question!)
You can be sure to be able to see all of the columns (up to a maximum of 50 columns) using the command:
options(repr.matrix.max.cols=50)Finally, make a table, sort the results, and display the biggest 20 values, as shown in the video.
-
Which 20 airports are the most popular in this regard, i.e., in terms of having the most flights originating from those airports?
-
Be sure to document your work from Question 3, using some comments and insights about your work.
Question 4 (2 pts)
In the Olympics data stored here:
/anvil/projects/tdm/data/olympics/athlete_events.csv
consider how many times that each City occurs in the data. Find the top 10 most popular cities, according to how many times that they occur. For each of these top 10 most popular cities, list the city name and the number of times that it occurred in the data set.
(The same method that you used in Question 3 should work.)
-
Find the top 10 most popular cities, according to how many times that they occur. For each of these top 10 most popular cities, list the city name and the number of times that it occurred in the data set.
-
Be sure to document your work from Question 4, using some comments and insights about your work.
Question 5 (2 pts)
For the 20 most popular airports (from Question 3), make a dotchart that shows how many flights originated from each of those airports in the year 2007.
Similarly, for the 10 most popular cities in the Olympics data (from Question 4), make a dotchart that shows how many times each city occurred in the Olympics data.
-
Make a
dotchartthat shows how many flights originated from each of the 20 most popular airports in the year 2007. -
Make a
dotchartthat shows how many times each of the 10 most popular cities occurred in the Olympics data. -
Be sure to document your work from Question 5, using some comments and insights about your work.
Submitting your Work
Please make sure that you added comments for each question, which explain your thinking about your method of solving each question. Please also make sure that your work is your own work, and that any outside sources (people, internet pages, generative AI, etc.) are cited properly in the project template.
Congratulations! Assuming you’ve completed all the above questions, you’ve just finished your first project for TDM 10100! If you have any questions or issues regarding this project, please feel free to ask in seminar, over Piazza, or during office hours.
Prior to submitting your work, you need to put your work into the project template, and re-run all of the code in Jupyter Lab and make sure that the results of running that code is visible in your template. Please check the detailed instructions on how to ensure that your submission is formatted correctly. To download your completed project, you can right-click on the file in the file explorer and click 'download'.
Once you upload your submission to Gradescope, make sure that everything appears as you would expect to ensure that you don’t lose any points. We hope your first project with us went well, and we look forward to continuing to learn with you on future projects!!
-
firstname_lastname_project1.ipynb
|
It is necessary to document your work, with comments about each solution. All of your work needs to be your own work, with citations to any source that you used. Please make sure that your work is your own work, and that any outside sources (people, internet pages, generative AI, etc.) are cited properly in the project template. You must double check your Please take the time to double check your work. See here for instructions on how to double check this. You will not receive full credit if your |