TDM 20100: Project 1 — 2023
Motivation: It’s been a long summer! Last year, you got some exposure to both R and Python. This semester, we will venture away from R and Python, and focus on UNIX utilities like sort, awk, grep, and sed. While Python and R are extremely powerful tools that can solve many problems — they aren’t always the best tool for the job. UNIX utilities can be an incredibly efficient way to solve problems that would be much less efficient using R or Python. In addition, there will be a variety of projects where we explore SQL using sqlite3 and MySQL/MariaDB.
We will start slowly, however, by remembering how to work with Jupyter Lab. In this project we will become re-familiarized with our development environment, review some, and prepare for the rest of the semester.
Context: This is the first project of the semester! We will start with some review, and set the "scene" to learn about some powerful UNIX utilities, and SQL the rest of the semester.
Scope: Jupyter Lab, R, Python, Anvil, markdown
Dataset(s)
The following questions will use the following dataset(s):
-
/anvil/projects/tdm/data/flights/subset/1991.csv
Setting Up to Work
This year we will be using Jupyter Lab on the Anvil cluster. Let’s begin by launching your own private instance of Jupyter Lab using a small portion of the compute cluster.
Navigate and login to ondemand.anvil.rcac.purdue.edu using your ACCESS credentials (including 2-factor authentication using Duo Mobile). You will be met with a screen, with lots of options. Don’t worry, however, the next steps are very straightforward.
|
If you did not (yet) set up your 2-factor authentication credentials with Duo, you can set up the credentials here: the-examples-book.com/starter-guides/anvil/access-setup |
Towards the middle of the top menu, click on the item labeled My Interactive Sessions. (Depending on the size of your browser window, there might only be an icon; it is immediately to the right of the menu item for The Data Mine.) On the left-hand side of the screen you will be presented with a new menu. You will see that there are a few different sections: Bioinformatics, Interactive Apps, and The Data Mine. Under "The Data Mine" section, near the bottom of your screen, click on Jupyter Notebook. (Make sure that you choose the Jupyter Notebook from "The Data Mine" section.)
If everything was successful, you should see a screen similar to the following.
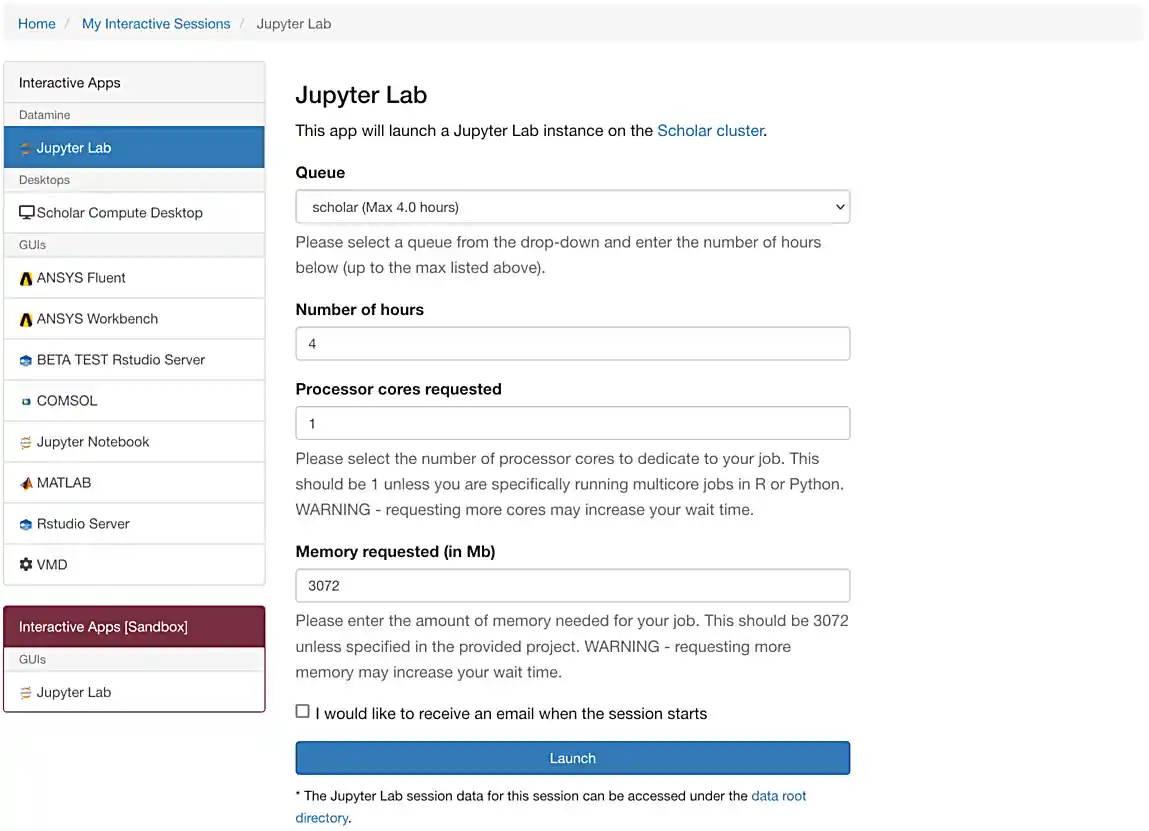
Make sure that your selection matches the selection in Figure 1. Once satisfied, click on Launch. Behind the scenes, OnDemand launches a job to run Jupyter Lab. This job has access to 1 CPU core and 1918 MB of memory.
|
As you can see in the screenshot above, each core is associated with 1918 MB of memory. If you know how much memory your project will need, you can use this value to choose how many cores you want. In this and most of the other projects in this class, 1-2 cores is generally enough. |
|
Please use 4 cores for this project. This is almost always excessive, but for this project in question 3 you will be reading in a rather large dataset that will very likely crash your kernel without at least 3-4 cores. |
We use the Anvil cluster because it provides a consistent, powerful environment for all of our students, and it enables us to easily share massive data sets with the entire Data Mine.
After a few seconds, your screen will update and a new button will appear labeled Connect to Jupyter. Click on this button to launch your Jupyter Lab instance. Upon a successful launch, you will be presented with a screen with a variety of kernel options. It will look similar to the following.
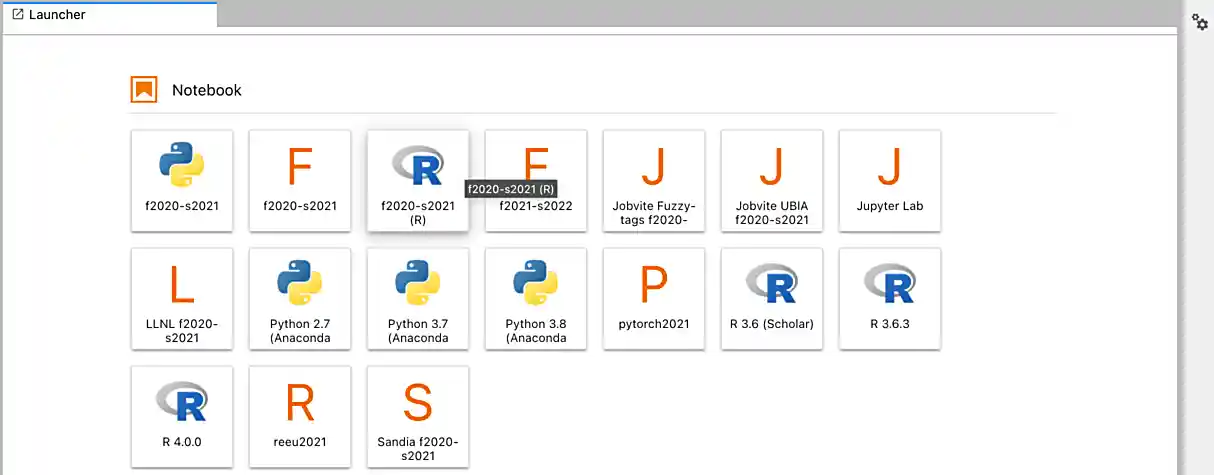
There are 2 primary options that you will need to know about.
- seminar
-
The
seminarkernel runs Python code but also has the ability to run R code or SQL queries in the same environment.
|
To learn more about how to run R code or SQL queries using this kernel, see our template page. |
- seminar-r
-
The
seminar-rkernel is intended for projects that only use R code. When using this environment, you will not need to prepend%%Rto the top of each code cell.
For now, let’s focus on the seminar kernel. Click on seminar, and a fresh notebook will be created for you.
The first step to starting any project should be to download and/or copy our project template (which can also be found on Anvil at /anvil/projects/tdm/etc/project_template.ipynb).
Open the project template and save it into your home directory, in a new notebook named firstname-lastname-project01.ipynb.
There are 2 main types of cells in a notebook: code cells (which contain code which you can run), and markdown cells (which contain comments about your work).
Fill out the project template, replacing the default text with your own information, and transferring all work you’ve done up until this point into your new notebook. If a category is not applicable to you (for example, if you did not work on this project with someone else), put N/A.
Questions
Question 1 (1 pt)
-
How many cores and how much memory (in GB) does Anvil’s sub-cluster A have? (0.5 pts)
-
How many cores and how much memory (in GB) does your personal computer have? (0.5 pts)
For this course, projects will be solved using the Anvil computing cluster.
Each cluster is a collection of nodes. Each node is an individual machine, with a processor and memory (often called RAM, or Random Access Memory). Use the information on the provided webpages to calculate how many cores and how much memory is available in total for Anvil’s "sub-cluster A".
Take a minute and figure out how many cores and how much memory is available on your own computer. If you do not have a computer of your own, work with a friend to see how many cores there are, and how much memory is available, on their computer.
|
Information about the core and memory capacity of Anvil "sub-clusters" can be found here. Information about the core and memory capacity of your computer is typically found in the "About this PC" section of your computer’s settings. |
-
A sentence (in a markdown cell) explaining how many cores and how much memory is available to Anvil sub-cluster A.
-
A sentence (in a markdown cell) explaining how many cores and how much memory is available, in total, for your own computer.
Question 2 (1 pt)
-
Using Python, what is the name of the node on Anvil you are running on?
-
Using Bash, what is the name of the node on Anvil you are running on?
-
Using R, what is the name of the node on Anvil you are running on?
Our next step will be to test out our connection to the Anvil Computing Cluster! Run the following code snippets in a new cell. This code runs the hostname command and will reveal which node your Jupyter Lab instance is running on (in three different languages!). What is the name of the node on Anvil that you are running on?
import socket
print(socket.gethostname())
%%R
system("hostname", intern=TRUE)%%bash
hostname|
To run the code in a code cell, you can either press Ctrl+Enter on your keyboard or click the small "Play" button in the notebook menu. |
Check the results of each code snippet to ensure they all return the same hostname. Do they match? You may notice that R prints some extra "junk" output, while bash and Python do not. This is nothing to be concerned about as different languages can handle output differently, but it is good to take note of.
-
Code used to solve this problem, along with the output of running that code.
Question 3 (1 pt)
-
Run each of the example code snippets below, and include them and their output in your submission to get credit for this question.
|
Remember, in the upper right-hand corner of your notebook you will see the current kernel for the notebook, |
In this course, we will be using Jupyter Lab with multiple different languages. Often, we will center a project around a specific language and choose the kernel for that langauge appropriately, but occasionally we may need to run a language in a kernel other than the one it is primarily built for. The solution to this is using line magic!
Line magic tells our code interpreter that we are using a language other than the default for our kernel (i.e. The seminar kernel we are currently using is expecting Python code, but we can tell it to expect R code instead.)
Line magic works by having the very first line in a code cell formatted like so:
%%language
Where language is the language we want to use. For example, if we wanted to run R code in our seminar kernel, we would use the following line magic:
%%R
Practice running the following examples, which include line magic where needed.
- python
import pandas as pd
df = pd.read_csv('/anvil/projects/tdm/data/flights/subset/1991.csv')
df[df["Month"]==12].head() # get all flights in December- SQL
%sql sqlite:////anvil/projects/tdm/data/movies_and_tv/imdb.db%%sql
-- get all episodes called "Finale"
SELECT *
FROM episodes AS e
INNER JOIN titles AS t
ON t.title_id = e.episode_title_id
WHERE t.primary_title = 'Finale'
LIMIT 5;- bash
%%bash

names="John Doe;Bill Withers;Arthur Morgan;Mary Jane;Rick Ross;John Marston"
echo $names | cut -d ';' -f 3
echo $names | cut -d ';' -f 6|
In the above examples you will see lines such as In the future, you will likely stick to using the kernel that matches the project language, but we wanted you to have a demonstration about "line magic" in Project 1. Line magic is a handy trick to know! To learn more about how to run various types of code using the |
-
Code from the examples above, and the outputs produced by running that code.
Question 4 (1 pt)
-
How many code cells are there in the default template? (0.5 pts)
-
How many markdown cells are there in the default template? (0.5 pts)
As we mentioned in the Setting Up section of this project, there are 2 main types of cells in a notebook: code cells (which contain code which you can run), and markdown cells (which contain markdown text which you can render into nicely formatted text). How many cells of each type are there in this template by default?
-
The number of cells of each type in the default template, in a markdown cell.
Question 5 (1 pt)
-
Create an unordered list of at least 3 of your favorite interests. Italicize at least one of these. (0.5 pts)
-
Create an ordered list of at least 3 of your favorite interests. Embolden at least one of these, and make at least one other item formatted like
code. (0.5 pts)
Markdown is well worth learning about. You may already be familiar with it, but more practice never hurts, and there are plenty of niche tricks you may not know!
|
For those new to Markdown, please review this cheat sheet! |
Create a Markdown cell in your notebook. For this question, we would like you to create two lists as follows.
Firstly, create an unordered list of at least 3 of your favorite interests (some examples could include sports, animals, music, etc.). Within this list, italicize at least one item.
Secondly, create an ordered list that orders the items in your previous list, from most favorite to least favorite. In this list, embolden at least one item, and make at least one other item formatted like code.
|
Don’t forget to "run" your markdown cells by clicking the small "Play" button in the notebook menu. Running a markdown cell will render the text in the cell with all of the formatting you specified. Your unordered lists will be bulleted and your ordered lists will be numbered. |
-
Unordered list of 3+ items with at least one italicized item.
-
Ordered list of 3+ items with at least one emboldened item and at least one
codeitem.
Question 6 (1 pt)
-
Write your own LinkedIn "About" section using Markdown that includes a header, body text that you would be comfortable adding to your LinkedIn account, and at least one link using Markdown syntax.
Browse www.linkedin.com and read some profiles. Pay special attention to accounts with an "About" section. Write your own personal "About" section using Markdown in a new Markdown cell, with the following features:
-
A header for this section (your choice of size) that says "About".
-
The body text of your personal "About" section that you would feel comfortable uploading to LinkedIn.
-
In the body text of your "About" section, for the sake of learning markdown, include at least 1 link using Markdown’s link syntax.
|
A Markdown header is a line of text at the top of a Markdown cell that begins with one or more |
-
A markdown cell containing your LinkedIn "About" entry, as described above.
Question 7 (2 pts)
-
Create a function in Python to print the median, mean, and standard deviation of the
DepDelaycolumn in our dataset, along with the shape of the/anvil/projects/tdm/data/flights/subset/1991.csvdataset overall. (1 pt) -
Create an R function to print the median, mean, and standard deviation of the
DepDelaycolumn in our dataset, along with the shape of the/anvil/projects/tdm/data/flights/subset/1991.csvdataset overall. (1 pt)
This question may seem a bit difficult at first, but these are all concepts we covered in the 100 level of the class! Remember, your previous projects are still on Anvil (assuming you haven’t deleted/overwritten them) and can be a great resource to look back on. You may also look back at the previous 100 level project instructions on The Examples Book.
Using pandas in Python, create a function that takes a dataframe as input and prints the shape of the dataframe along with the mean, median, and standard deviation of the DepDelay column of that dataframe. Print your results formatted as follows:
MyDF Summary Statistics ---
Shape: (rows, columns)
Mean: 123.456
Median: 123.456
Standard Deviation: 123.456
---------------------------
Then, recreate your function but this time using R. Remember that you will need to use the %%R line magic at the top of your cell to tell the kernel that you are using R code. You should not need to import any libraries in order to do this.
|
The |
|
It is not important that your function output is formatted the exact same as ours. What is important, however, is that any printing that occurs in your code is neat and well formatted. If it is hard for the graders to read, you may lose points. Do your best and we will always work together to improve things. |
Make sure your code is complete, and well-commented. Double check that both functions return the same values as a built-in sanity check for your code.
-
Python Function to print median, mean, and standard deviation of the
DepDelaycolumn of our dataset, along with the shape of the dataset. -
R Function to print median, mean, and standard deviation of the
DepDelaycolumn of our dataset, along with the shape of the dataset.
Submitting your Work
Congratulations, you just finished your first assignment for this class! Now that we’ve written some code and added some markdown cells to explain what we did, we are ready to submit our assignment. For this course, we will turn in a variety of files, depending on the project.
We will always require a Jupyter Notebook file. Jupyter Notebook files end in .ipynb. This is our "source of truth" and what the graders will turn to first when grading.
|
You must double check your You will not receive full credit if your |
A .ipynb file is generated by first running every cell in the notebook (which can be done quickly by pressing the "double play" button along the top of the page), and then clicking the "Download" button from .
In addition to the .ipynb file, an additional file should be included for each programming language in the project containing all of the code from that langauge that is in the project. A full list of files required for the submission will be listed at the bottom of the project page.
Let’s practice. Take the R code from this project and copy and paste it into a text file with the .R extension. Call it firstname-lastname-project01.R. Do the same for each programming language, and ensure that all files in the submission requirements below are included. Once complete, submit all files as named and listed below to Gradescope.
-
firstname-lastname-project01.ipynb. -
firstname-lastname-project01.R. -
firstname-lastname-project01.py. -
firstname-lastname-project01.sql. -
firstname-lastname-project01.sh.
|
Please make sure to double check that your submission is complete, and contains all of your code and output before submitting. If you are on a spotty internet connection, it is recommended to download your submission after submitting it to make sure what you think you submitted, was what you actually submitted. In addition, please review our submission guidelines before submitting your project. |
Here is the Zoom recording of the 4:30 PM discussion with students from 21 August 2023: