STAT 19000: Project 2 — Fall 2021
Introduction to R using WHIN weather data
Motivation: The R environment is a powerful tool to perform data analysis. R is a tool that is often compared to Python. Both have their advantages and disadvantages, and both are worth learning. In this project we will dive in head first and learn some of the basics while solving data-driven problems.
|
R and Python both have their advantages and disadvantages. There still exist domains and problems where R is better than Python, and where Python is better than R. In addition, Julia is another language in this domain that is quickly gaining popularity for it’s speed and Python-like ease of use. |
Context: In the last project we set the stage for the rest of the semester. We got some familiarity with our project templates, and modified and ran some R code. In this project, we will continue to use R within Jupyter Lab to solve problems. Soon, you will see how powerful R is and why it is often a more effective tool to use than a tool like spreadsheets.
Scope: r, vectors, indexing, recycling
Dataset(s)
The following questions will use the following dataset(s):
-
/depot/datamine/data/whin/stations.csv -
/depot/datamine/data/whin/weather.csv
|
These datasets are generously provided to us by one of our corporate partners, the Wabash Heartland Innovation Network (WHIN). You can learn more about WHIN on their website at WHIN. You can learn more about their API here. This won’t be the last time we work with WHIN data, in the future you will get the opportunity to use their API to solve problems that you might not have thought of. |
Questions
Question 1
While you may not always (and perhaps even rarely) be provided with a neat and clean dataset to work on, when you do, getting a good feel for the dataset(s) is a good first step to solving any data-driven problems.
Use the read.csv function to load our datasets into data.frame`s named `stations and weather.
|
|
Use functions like head, tail, str, and summary to explore the data. What are the dimensions of each dataset? What are the first 5 rows of stations? What are the first 5 rows of weather? What are the names of the columns in each dataset?
-
Code used to solve this problem.
-
Output from running the code.
-
Text answering all of the questions above.
Question 2
The following R code extracts the temperature column from our weather data.frame, into a vector named temp.
temp <- weather$temperatureWhat is the first value in the vector? How about the 100th? What is the last? What type of data is in the vector?
|
Use the |
-
Code used to solve this problem.
-
Output from running the code.
Question 3
You should now know at least 1 method for extracting data from a data.frame (using the $), and should now understand a little bit about indexing. Thats great! Use indexing to add the first 100 rain_inches_last_hour from the weather data.frame to the last 100 rain_inches_last_hour from the weather data.frame to a new vector named temp100. Do this in 1 line of code.
-
Code used to solve this problem.
-
Output from running the code.
Question 4
In question (3) we were able to rapidly add values together from two subsets of the same vector. This worked out very nicely because both subsets of data contained 100 values. The first value from the first subset of data was added to the first value from the second subset of data, and so on.
For station with station_id 20, get a vector containing all temperature >= 85. Call this vector hot_temps. Get a vector containing all temperature <= 40, and call this vector cold_temps. How many elements are in hot_temps? How many elements are in cold_temps? Attempt to add the vectors together. What happens? Read this to understand what is happening.
|
This is called recycling. Recycling is a very powerful feature of R. It allows you to reuse the same vector elements in different contexts. It can also be a very misleading and dangerous feature as it can lead to unexpected results. This is why it is important to pay attention when R gives you a warning — something that you aren’t expecting may be happening behind the scenes. |
-
Code used to solve this problem.
-
Output from running the code.
Question 5
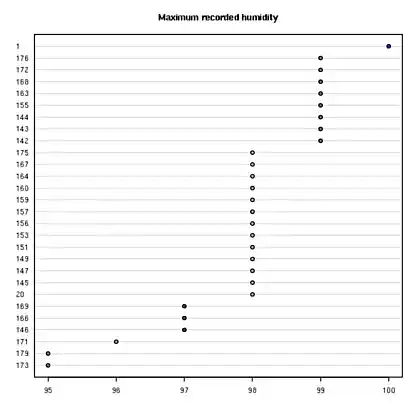
Pick any station you are interested in, and create one or more dotplots showing data from any of the columns you are interested in. For each plot, write 1-2 sentences describing any patterns you see. If you don’t see any patterns, that is okay, just write, "I don’t see any patterns.".
|
This is a good opportunity to look at the data in the dataset and explore the variables and see what types of patterns the various variables have. Please feel free to spruce up your plots if you so desire — it is completely optional, and we will have plenty of time to work on plots as the semester progresses. |
-
Code used to solve this problem.
-
Output from running the code.
-
1-2 sentences describing any patterns you see.
Question 6
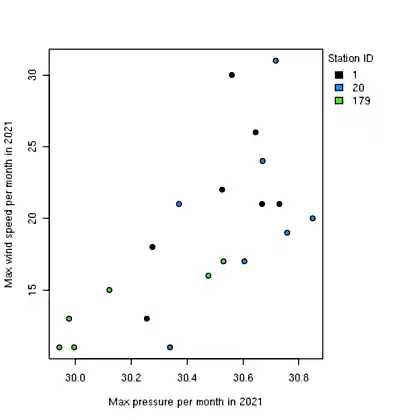
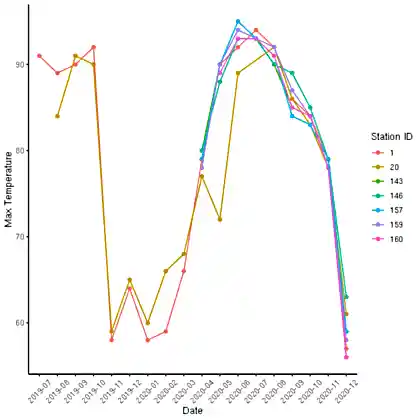
The following three pieces of code each create a graphic. The first two graphics are created using only core R functions. The third graphic is created using a package called ggplot. We will learn more about all of these things later on. For now, pick your favorite graphic, and write 1-2 sentences explaining why it is your favorite, what could be improved, and include any interesting observations (if any).
-
1-2 sentences explaining which is your favorite graphic, why, what could be improved, and any interesting observations you may have (if any).
|
Please make sure to double check that your submission is complete, and contains all of your code and output before submitting. If you are on a spotty internet connection, it is recommended to download your submission after submitting it to make sure what you think you submitted, was what you actually submitted. |