STAT 19000: Project 5 — Spring 2021
Motivation: Up until this point we’ve utilized bits and pieces of the pandas library to perform various tasks. In this project we will formally introduce pandas and numpy, and utilize their capabilities to solve data-driven problems.
Context: By now you’ll have had some limited exposure to pandas. This is the first in a three project series that covers some of the main components of both the numpy and pandas libraries. We will take a two project intermission to learn about functions, and then continue.
Scope: python, pandas, numpy, DataFrames, Series, ndarrays, indexing
Dataset
The following questions will use the dataset found in Scholar:
/class/datamine/data/stackoverflow/unprocessed/2018.csv
/class/datamine/data/stackoverflow/unprocessed/2018.parquet
/class/datamine/data/stackoverflow/unprocessed/2018.feather
Questions
Question 1
Take a look at the pandas docs. There are a lot of formats that pandas has the ability to read. The most popular formats in this course are: csv (with commas or some other separator), excel, json, or some database. CSV is very prevalent, but it was not designed to work well with large amounts of data. Newer formats like parquet and feather are designed from the ground up to be efficient, and take advantage of special processor instruction set called SIMD. The benefits of using these formats can be significant. Let’s do some experiments!
How much space do each of the following files take up on Scholar: 2018.csv, 2018.parquet, and 2018.feather? How much smaller (as a percentage) is the parquet file than the csv? How much smaller (as a percentage) is the feather file than the csv? Use f-strings to format the percentages.
Time reading in the following files: 2018.csv, 2018.parquet, and 2018.feather. How much faster (as a percentage) is reading the parquet file than the csv? How much faster (as a percentage) is reading the feather file than the csv? Use f-strings to format the percentages.
To time a piece of code, you can use the block-timer package:
from block_timer.timer import Timer
with Timer(title="Using dict to declare a dict") as t1:
    my_dict = dict()
with Timer(title="Using {} to declare a dict") as t2:
    my_dict = {}
# or if you need more fine-tuned values
print(t1.elapsed)
print(t2.elapsed)
Read the 2018.csv file into a pandas DataFrame called my2018. Time writing the contents of my2018 to the following files: 2018.csv, 2018.parquet, and 2018.feather. Write the files to your scratch directory: /scratch/scholar/<username>, where <username> is your username. How much faster (as a percentage) is writing the parquet file than the csv? How much faster (as a percentage) is writing the feather file than the csv? Use f-strings to format the percentages.
-
Python code used to solve the problem.
-
Output from running your code.
Question 2
A method is just a function associated with an object or class. For example, mean is just a method of the pandas DataFrame:
# myDF is an object of class DataFrame
# mean is a method of the DataFrame class
myDF.mean()
In pandas there are two main methods used for indexing: loc and iloc. Use the column Student and indexing in pandas to calculate what percentage of respondents are students and not students. Consider the respondent to be a student if the Student column is anything but "No". Create a new DataFrame called not_students that is a subset of the original dataset without students.
-
Python code used to solve the problem.
-
Output from running your code.
Question 3
In pandas, if you were to isolate a single column using indexing, like this:
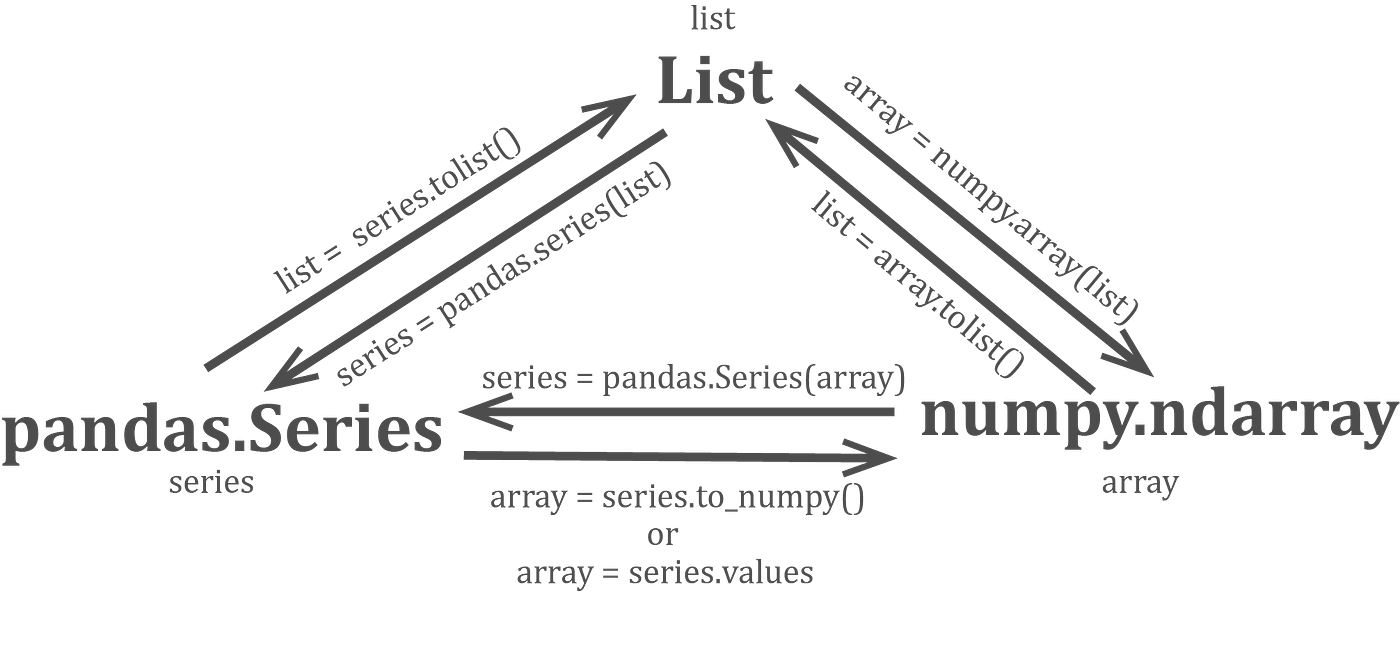
myDF.loc[:, "Student"]The result would be a pandas Series. A Series is the 1-dimensional equivalent of a DataFrame.
type(myDF.loc[:, "Student"]) # pandas.core.series.Seriespandas and numpy make it very easy to convert between a Series, ndarray, and list. Here is a very useful graphic to highlight how to do this. Look at the DevType column in not_students. As you can see, a single value may contain a list of semi-colon-separated professions. Create a list with a unique group of all the possible professions. Consider each semi-colon-separated value a profession. How many professions are there?
It looks like somehow the profession "Student" got in there even though we filtered by the Student column. Use not_students to get a subset of our data for which the respondents replied "No" to Student, yet put "Student" as one of many possible `DevType`s. How many respondents are in that subset?
|
If you have a column containing strings in |
|
See here. |
-
Python code used to solve the problem.
-
Output from running your code.
-
The number of professions there are.
-
The number of respondents that replied "No" to
Student, yet put "Student" as theDevType.
Question 4
As you can see, while perhaps a bit more strict, indexing in pandas is not that much more difficult than indexing in R. While not always necessary, remembering to put ":" to indicate "all columns" or "all rows" makes life easier. In addition, remembering to put parentheses around logical groupings is also a good thing. Practice makes perfect! Randomly select 100 females and 100 males. How many of each sample is in each Age category? (Do not use the sample method yet, but instead use numeric indexing and random)
import random
print(f"A random integer between 1 and 100 is {random.randint(1, 101)}")
It would be nice to visualize these results. pandas Series have some built in methods to create plots. Use this method to generate a bar plot for both females and males. How do they compare?
|
You may need to import |
|
Once you have your female and male DataFrames, the |
-
Python code used to solve the problem.
-
Output from running your code.
Question 5
pandas really helps out when it comes to working with data in Python. This is a really cool dataset, use your newfound skills to do a mini-analysis. Your mini-analysis should include 1 or more graphics, along with some interesting observation you made while exploring the data.
-
Python code used to solve the problem.
-
Output from running your code.
-
A graphic.
-
1-2 sentences explaining your interesting observation and graphic.