TDM 30100: Project 05 - Classifiers - K-Nearest Neighbors (KNN) I
Project Objectives
In this project, we will go learn about the K-Nearest Neighbors (KNN) machine learning algorithm, develop it without the use of a library, and apply it to a small dataset.
Questions
Question 1 (2 points)
First, let’s learn the basics of how a KNN works. A KNN operates by calculating the difference between input features to all samples in its existing database, and performing a majority vote between the k closest samples to classify the input features. If k=1, it simply chooses the closest class. If k=3, it takes chooses the majority between the 3 nearest. If there is ever a tie, the default behavior is to select a random class from the tied classes.
|
This random selection during a tie is not ideal, but it is a simple way to handle the case. In the next project, we will explore a way to handle ties in a more sophisticated manner. |
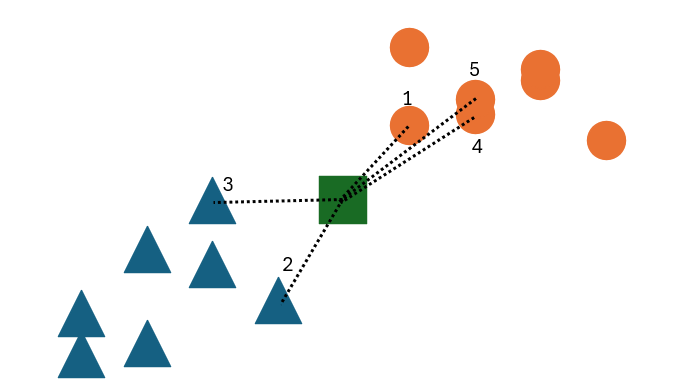
Take the above example. Suppose we have some dataset containing 2 classes, represented by blue triangles and orange circles. If we have some unknown point (the green square), we can classify it by finding the k closest points to it and taking a majority vote. In this case, the 5 closest points are shown with dashed lines and labeled in order.
If k=1, what would the unknown point be classified as? If k=3, what would it be classified as? If k=5, what would it be classified as?
To think about this simply, let’s look at an example with 2 input features. This dataset uses a hue and size to identify fruit.
# |
Hue |
Size |
Output Variable |
1 |
22 |
1 |
Banana |
2 |
27 |
.9 |
Banana |
3 |
87 |
.05 |
Grape |
4 |
84 |
.03 |
Grape |
Given this dataset, we want to identify a fruit with Hue=24, Size=0.95.
To find the distance between 2d points, you can use the formula
$ \text{dist} = \sqrt{(X-X_0)^2 + (Y-Y_0)^2} $
-
What class would our the green square be classified as if k=1? if k=3? if k=5?
-
Which point is our unknown fruit closest to? (put the #)
-
What fruit should our unknown fruit be classified as, assuming k=1?
-
What would happen if we set k=4?
Question 2 (2 points)
Now that we understand the basics of how a KNN works, let’s create a KNN from scratch in python.
We will still use pandas to load the dataset and scikit-learn to scale and split the data, but we will not use scikit-learn to create the KNN.
First, let’s load the Iris dataset, separate the data into features and labels (hint: the Species column is our target variable), scale the input features, and split the data into training and testing sets (80% training, 20% testing).
|
Please review your work from Project 1 and Project 3 if you need a refresher on how to import a dataset, and how to scale and split data. If you did not complete project 3, please read the StandardScaler documentation and the train_test_split documentation, or ask a TA for help during office hours. |
# Import libraries
import pandas as pd
from sklearn.preprocessing import StandardScaler
from sklearn.model_selection import train_test_split

# load the dataframe into `df`
'''YOUR CODE TO LOAD THE DATAFRAME'''

# separate the data into input features 'X' and output variable 'y'. Be sure to remove the 'Id' column from the input features
'''YOUR CODE TO SEPARATE THE DATA'''

# scale the input features into `X_scaled`
'''YOUR CODE TO SCALE THE INPUT FEATURES'''

# split the data into training 'X_train' and 'y_train' and testing 'X_test' and 'y_test' sets. Use a test size of 0.2 and random state of 42
'''YOUR CODE TO SPLIT THE DATA'''|
train_test_split returns 4 variables in the order X_train, X_test, y_train, y_test. Although we provided pandas dataframes, the train_X and test_X variables will be numpy arrays. However, the y_train and y_test variables will remain pandas series. This may cause confusion in future code, so it may be helpful to convert the pandas series to numpy arrays using their |
Please print the first 5 rows of the testing input features to confirm whether your data is processed correctly.
-
Output the first 5 rows of the testing input features
Question 3 (2 points)
Now that we have our data loaded, scaled, and split, let’s start working on creating a KNN from scratch.
Over the next 3 questions, we will fill in functions in the KNN class below that are needed to classify new data points and test the model.
'''
class : `KNN`
init inputs : `X_train` (list[list[float]]), `y_train` (list[str])

description : This class stores the training data and classifies new data points using the KNN algorithm.
'''
class KNN:
    def __init__(self, X_train, y_train):
        self.features = X_train
        self.labels = y_train

    def train(self, X_train, y_train):
        self.features = X_train
        self.labels = y_train

    def euc_dist(self, point1, point2):
        '''YOUR CODE TO CALCULATE THE EUCLIDEAN DISTANCE'''
        pass

    def classify(self, new_point, k=1):
        '''YOUR CODE TO CLASSIFY A NEW POINT'''
        pass

    def test(self, X_test, y_test, k=1):
        '''YOUR CODE TO TEST THE MODEL'''
        pass
First, let’s fill in the euc_dist function that calculates the Euclidean distance between two n-dimensional points. The formula for the Euclidean distance between two points is
$ \text{dist} = \sqrt{(X_1-X_2)^2 + (Y_1-Y_2)^2 + … + (Z_1-Z_2)^2} $
where X, Y, Z, etc. are the n-dimensional coordinates of the two points.
We can imagine each row in our dataset as a point in n-dimensional space, where n is the number of input features. The Euclidean distance between two points is the straight-line distance between them. It can be difficult to visualize in higher dimensions, but the formula remains the same.
The inputs for this function are point1 and point2, which are each rows from our dataset. The output should be the float value of the Euclidean distance between the two points.
|
With pandas dataframes, you can perform operations between rows. For example, if you have |
One thing that you should learn how to do is test functions that you write. Instead of creating the whole KNN and making sure the code works at the very end, it is important to test each piece of code as we right it. We can create test cases to see if our function is working as expected. Some test cases have been provided to you below. For this function, please create 2-3 test cases of your own to ensure that your function works as expected.
|
In python, we can use the |
import numpy as np
# make a knn object
knn = KNN(X_train, y_train)
# test the euc_dist function
assert knn.euc_dist(np.array([1,2,3]), np.array([1,2,3])) == 0
assert knn.euc_dist(np.array([1,2,3]), np.array([1,2,4])) == 1
assert knn.euc_dist(np.array([0,0]), np.array([3,4])) == 5
# your test cases here:
To test that your function works, calculate the Euclidean distance between the first two rows of the training input features by running the code below.
# make a knn object
knn = KNN(X_train, y_train)
print(knn.euc_dist(X_train[0], X_train[1]))-
Your own test cases for the
euc_distfunction -
Output of calculating the euclidean distance between the first two rows of the training input features
Question 4 (2 points)
Now that we have a function to calculate the Euclidean distance between two points, let’s work on the classify function, which will classify a new point using the KNN algorithm.
To classify a point, we need to calculate the Euclidean distance between the new point and all points in the training data. Then, we can find the k closest points and take a majority vote to classify the new point.
Fill in the classify function to classify a new point using the KNN algorithm. If there is a tie, randomly select a class.
|
Since our features and labels are stored in separate variables, it is recommended that you use the |
|
To find the |
Below is some pseudocode to help you get started on the classify function.
def classify(self, new_point, k=1):
    # combine features and labels into a single list
    ### YOUR CODE HERE ###

    # sort the list by the euclidean distance between each point and the new point
    ### YOUR CODE HERE ###

    # get the k closest points
    ### YOUR CODE HERE ###

    # get the labels of the k closest points
    ### YOUR CODE HERE ###

    # find the majority class
    ### YOUR CODE HERE ###
To test that your function works, classify the first row of the testing input features using the KNN algorithm with k=3 by running the code below. You should get a classification of Iris-versicolor
# make a knn object
knn = KNN(X_train, y_train)
print(knn.classify(X_test[0], k=3))-
Classification of the first row of the testing input features using the KNN algorithm with k=3
Question 5 (2 points)
Now that we are able to classify a single point, let’s work on the test function, which will test the model on a dataframe of input features and output variables.
For this function, we simply need to iterate over all points in our input features, classify each point, and compare their classification to the actual output variable. We can then calculate the accuracy of our model by dividing the number of correct classifications by the total number of classifications.
Below is some pseudocode to help you get started on the test function.
def test(self, X_test, y_test, k=1):
    # for each point in X_test
    ### YOUR CODE HERE ###
        # classify the point
        ### YOUR CODE HERE ###

        # compare the classification to the actual output variable
        # if the classification is correct, increment a counter
        ### YOUR CODE HERE ###

    # calculate and return the accuracy of the model
    ### YOUR CODE HERE ###
To test that your function works, test the model on the testing input features and output variables using the KNN algorithm with k=1 by running the code below. You should get an accuracy of 0.9666666666666667
# make a knn object
knn = KNN(X_train, y_train)
print(knn.test(X_test, y_test, k=1))-
Accuracy of the model on the testing input features and output variables using the KNN algorithm with k=1
Submitting your Work
-
firstname_lastname_project5.ipynb
|
You must double check your You will not receive full credit if your |