TDM 19000: Heatmap
To find the similarity of each image to every single other image, you can do 'similarities = torch.matmul(features, features.T)'. Printing out similarities would display a tensor containing a vector for each image. Each vector would contain 30 values - 30 images, scoring the similarity to each of the other 29 images and themself. This is very hard to interpret.
To help with this, we can make a heatmap to visually show these similarity scores. First we build a matrix of all of the similarities:
similarities = torch.matmul(features, features.T)and then we can make a heatmap:
import matplotlib.pyplot as plt
import seaborn as sns

sns.heatmap(similarities.numpy(), xticklabels=filenames, yticklabels=filenames)
plt.show()
On the heatmap, there is a near-white diagonal line that shows the images that are 100% similar to each other - this only occurs on each image vs. itself.
If we wanted to actually look at the images that are scored as the most similar, we would first have to ignore the scores along this diagonal line, as it doesn’t tell us much of anything. There are a few different ways this could be done. We will simply set the diagonal (full of cosine similarity '1' values) so that each value is '0.7'.
|
In cosine similarity, -1 is used to represent items that are specifically opposite from each other. We could have set the diagonal values here to be -1, so that these scores would never show up as the most similar cases in our analysis. However, the lowest similarity score here is 0.7355 (found using 'similarities.min()'), and setting values of -1 would shift the color gradient too dramatically for any other values to have much meaning (img 2. below). So you should use 'similarities.fill_diagonal_(0.7)', to set the self-comparisons along the diagonal to be scored as 0.7. |
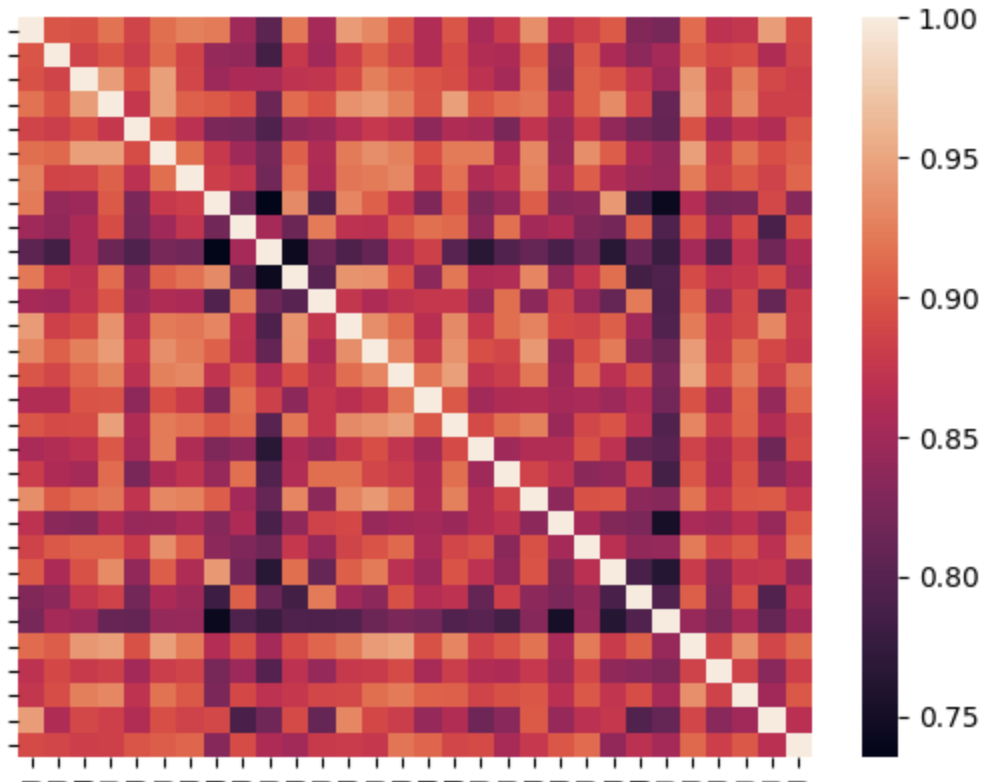
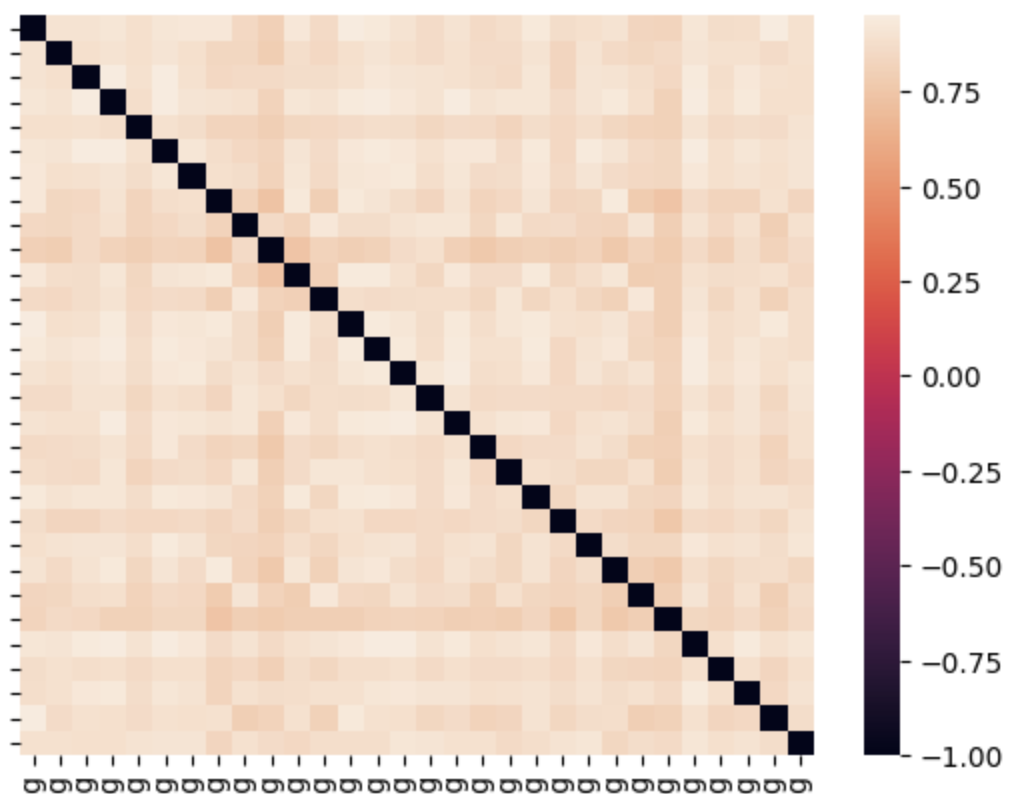
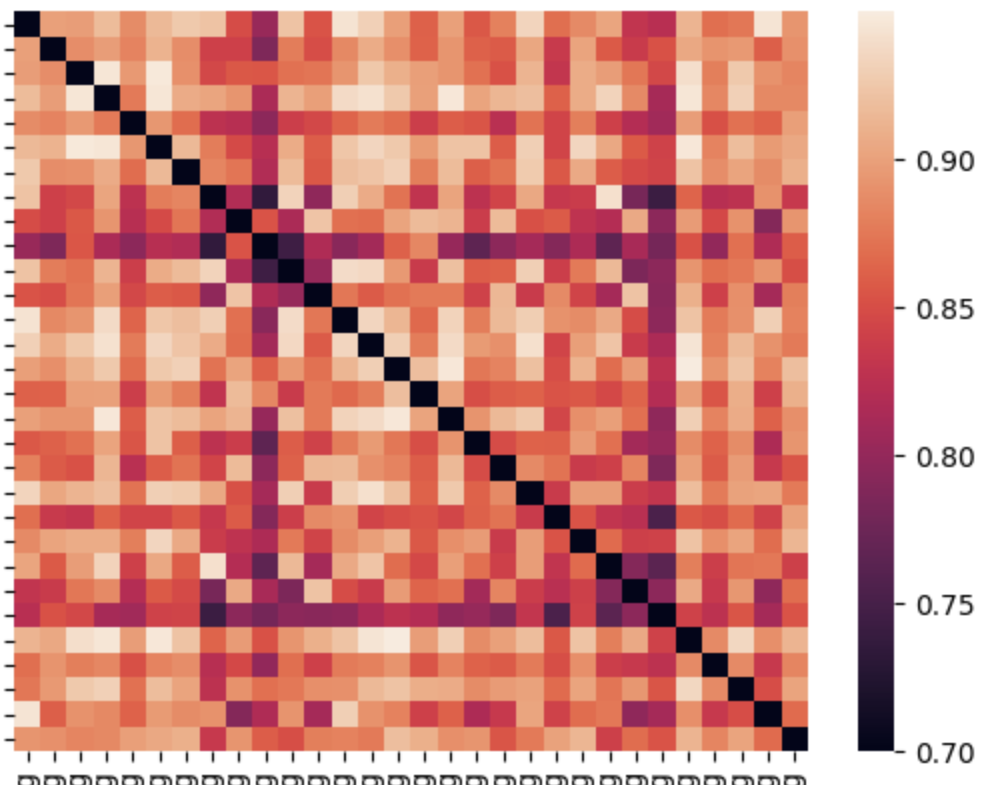
(Left to right: Original heatmap of similarity scores; Similarity scores with exact matches set to -1; Similarity scores with exact matches set to 0.7)
With the self-scoring image pairs out of the way, we can now find the pairs of images with the highest similarity scores.
# turn similarities (dictionary of vectors) into a 1D list
# then find the 40 largest similarity values
values, indices = torch.topk(similarities.flatten(), k=40)

# we will ignore the top 30 matches

# converts the flat indices back into (row, column)
# ( this is reversing the calculations from .flatten() )
pairs = [(idx.item() // len(filenames), idx.item() % len(filenames)) for idx in indices[30:40]]

# for each item pairing of i and j, print the similarity score
for i, j in pairs:
    print(f"{filenames[i]} & {filenames[j]} are of similarity = {similarities[i, j]}")
filepath = "/anvil/projects/tdm/data/images/Snails"
for i, j in pairs:
if i < j:
print(f"\n{filenames[i]} & {filenames[j]} are of similarity = {similarities[i, j]}")
img1 = Image.open(f"{filepath}/{filenames[i]}")
img2 = Image.open(f"{filepath}/{filenames[j]}")
fig, axes = plt.subplots(1, 2, figsize=(6, 3))
axes[0].imshow(img1)
axes[0].set_title(f"{filenames[i]}")
axes[0].axis("off")
axes[1].imshow(img2)
axes[1].set_title(f"{filenames[j]}")
axes[1].axis("off")
plt.show()|
When displaying the images, we use 'if i < j:' inside of the initial for loop. If you look at where we printed the similarity scores of the top image pairs, each set of two lines are the same images, just with image i and image j switched: |