Regression
Simple Linear Regression
Let’s consider a simple example. Let’s predict popularity from a single feature (e.g., duration of the song in minutes).
import matplotlib.pyplot as plt
import seaborn as sns

# Convert duration to minutes for training data
duration_min_train = X_train["duration_ms"] / 60000

plt.figure(figsize=(8,5))
sns.scatterplot(x=duration_min_train, y=y_train, alpha=0.6)
sns.regplot(x=duration_min_train, y=y_train, scatter=False, color="red", ci=None)

plt.xlabel("Duration (minutes)")
plt.ylabel("Popularity")
plt.title("Popularity vs. Duration (train set)")
plt.show()
Predictor (X): Duration (minutes)
Response (Y): popularity
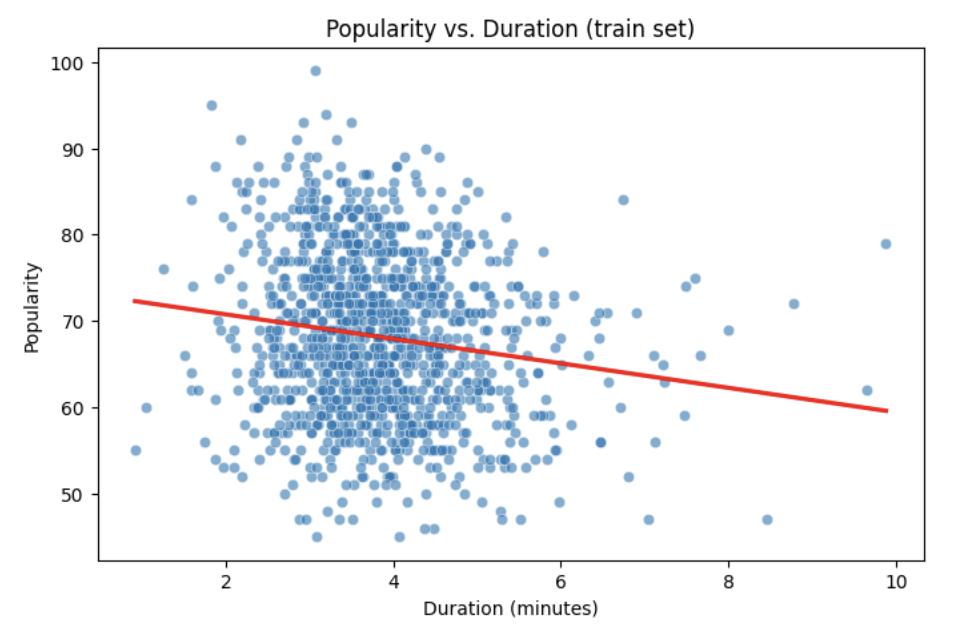
Broadly speaking, we would like to model the relationship between X and Y using the form:
Y = f(X) + $\epsilon$
-
If we fit the data with a horizontal line (e.g.,
f(x) = c), the model would not capture the relationship well. This is an example of underfitting. -
If we fit the data with a very wiggly curve that passes through nearly every point, the model becomes too complex. This is an example of overfitting.
So, our goal is to find a line that captures the main trend without falling into either extreme (underfitting or overfitting). The regression line should summarize the relationship between popularity (Y) and duration (X) well.
How Do We Define a Good Line?
We would like to use a linear function of X, writing our model with $\beta_1$ as the slope:
This shows:
-
$\beta_0$ = intercept
-
$\beta_1$ = slope (how much $Y$ changes for a one-unit change in $X$)
-
$\epsilon$ = error term
In simple linear regression, we model Y as a linear relationship with X_i
A good line is defined as one that produces small errors or residuals, meaning the predicted values are close to the observed values. In other words, the best line is the one where as many points as possible lie close to the regression line.
We find the line that minimizes the sum of all squared distances from the points to the line. That is:
In practice, software like Python’s statsmodels solves this using calculus and linear algebra. For example, the code below would estimate the coefficient for you and then you can view the results using model.summary().
import statsmodels.api as sm

X = df[["duration_min"]]
y = df["popularity"]

X = sm.add_constant(X)
model = sm.OLS(y, X).fit()
print(model.summary())